. 2011 Sep;21(9):1506-11.
doi: 10.1101/gr.121715.111. Epub 2011 Jul 12.

Barcoding bias in high-throughput multiplex sequencing of miRNA

Affiliations

Barcoding bias in high-throughput multiplex sequencing of miRNA

Shahar Alon et al. Genome Res. 2011 Sep.

Abstract

Second-generation sequencing is gradually becoming the method of choice for miRNA detection and expression profiling. Given the relatively small number of miRNAs and improvements in DNA sequencing technology, studying miRNA expression profiles of multiple samples in a single flow cell lane becomes feasible. Multiplexing strategies require marking each miRNA library with a DNA barcode. Here we report that barcodes introduced through adapter ligation confer significant bias on miRNA expression profiles. This bias is much higher than the expected Poisson noise and masks significant expression differences between miRNA libraries. This bias can be eliminated by adding barcodes during PCR amplification of libraries. The accuracy of miRNA expression measurement in multiplexed experiments becomes a function of sample number.


Figures

Figure 1.
Figure 1.
Barcoding bias analysis. (A,D) Total number of miRNA counts in each barcode compared with all the other barcodes (all the possible comparisons are plotted). The blue boxes represent points within the 99% region of Poisson noise, and the red boxes represent points outside this region. (A) When using ligation barcoding and normal mouse heart data, only 73% of all points fall inside this region, attesting for a barcode bias. (D) When using PCR barcoding and human brain data, 97% of all points fall inside the Poisson noise region. (B,E) The variance in counts number for a specific miRNA among the different barcodes as a function of the mean, plotted for all miRNAs. The black dotted line is the expected Poisson distribution with no barcode bias. The black full line is a fit to the general form expected for biased barcodes (see Methods). (B) When using ligation barcoding and normal mouse heart data, the variance due to barcodes diversity is much larger than the Poisson noise. (E) When using PCR barcoding and human brain data, only Poisson noise is evident for most of the experimentally relevant regime. (C,F) Hierarchical clustering of the miRNA expression profiles across different barcodes and biological conditions. (C) When using ligation-based barcodes, miRNA expression profiles cluster according to their barcodes, although they were derived from two different experimental conditions (normal and diseased mouse hearts, marked with WT and SH, respectively). (F) When using PCR-based barcodes, miRNA expression profiles cluster according to the experimental condition.
Figure 2.
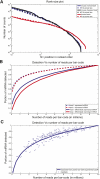
Figure 2.
Modeling the detection efficiency as a function of the number of multiplexed samples. (A) Rank-size plot. Mouse normal heart, mouse diseased heart, and human brain data are plotted in blue, black, and red, respectively. The dashed lines are fits to power law with exponential cutoff. The fit has the form N^(−1.4) × exp(−N/47), N^(−1.4) × exp(−N/43), and N^(−0.8) × exp(−N/68) for mouse normal hearts, mouse diseased hearts, and human brain, respectively. (B) Expected portion of expressed miRNA (dashed lines) and differentially expressed miRNA (full lines) detected as a function of the number of reads per barcode. Human brain data are plotted in red and mouse normal heart data in blue. (C) Portion of differentially expressed miRNA detected as a function of the number of reads per barcode (see Methods). The blue boxes represent real data, and the blue line is the same as in B. Only reads uniquely aligned to miRNAs were used.

References

    1. Bartel DP 2004. MicroRNAs: genomics, biogenesis, mechanism, and function. Cell 116: 281–297 - PubMed
    1. Cameron AC, Trivedi PK 1998. Regression analysis of count data. Cambridge University Press, Cambridge, UK
    1. Creighton CJ, Reid JG, Gunaratne PH 2009. Expression profiling of microRNAs by deep sequencing. Brief Bioinform 10: 490–497 - PMC - PubMed
    1. de Hoon MJ, Taft RJ, Hashimoto T, Kanamori-Katayama M, Kawaji H, Kawano M, Kishima M, Lassmann T, Faulkner GJ, Mattick JS, et al. 2010. Cross-mapping and the identification of editing sites in mature microRNAs in high-throughput sequencing libraries. Genome Res 20: 257–264 - PMC - PubMed
    1. Dohm JC, Lottaz C, Borodina T, Himmelbauer H 2008. Substantial biases in ultra-short read data sets from high-throughput DNA sequencing. Nucleic Acids Res 36: e105 doi: 10.1093/nar/gkn425 - PMC - PubMed

Publication types

LinkOut - more resources