. 2011 Nov;21(11):1892-904.
doi: 10.1101/gr.122218.111. Epub 2011 Jul 12.

Parallel evolution of transcriptome architecture during genome reorganization

Affiliations

Parallel evolution of transcriptome architecture during genome reorganization

Sung Ho Yoon et al. Genome Res. 2011 Nov.

Abstract

Assembly of genes into operons is generally viewed as an important process during the continual adaptation of microbes to changing environmental challenges. However, the genome reorganization events that drive this process are also the roots of instability for existing operons. We have determined that there exists a statistically significant trend that correlates the proportion of genes encoded in operons in archaea to their phylogenetic lineage. We have further characterized how microbes deal with operon instability by mapping and comparing transcriptome architectures of four phylogenetically diverse extremophiles that span the range of operon stabilities observed across archaeal lineages: a photoheterotrophic halophile (Halobacterium salinarum NRC-1), a hydrogenotrophic methanogen (Methanococcus maripaludis S2), an acidophilic and aerobic thermophile (Sulfolobus solfataricus P2), and an anaerobic hyperthermophile (Pyrococcus furiosus DSM 3638). We demonstrate how the evolution of transcriptional elements (promoters and terminators) generates new operons, restores the coordinated regulation of translocated, inverted, and newly acquired genes, and introduces completely novel regulation for even some of the most conserved operonic genes such as those encoding subunits of the ribosome. The inverse correlation (r=-0.92) between the proportion of operons with such internally located transcriptional elements and the fraction of conserved operons in each of the four archaea reveals an unprecedented view into varying stages of operon evolution. Importantly, our integrated analysis has revealed that organisms adapted to higher growth temperatures have lower tolerance for genome reorganization events that disrupt operon structures.


Figures
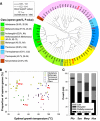
Figure 1.
Figure 1.
Operonization in archaeal genomes. (A) Phylogeny of 65 sequenced archaea and proportion of operon genes in each of the genomes. A species tree was constructed based on the concatenated alignments of ∼78 COGs by using FastTree (Price et al. 2010) and was retrieved from MicrobesOnline (Dehal et al. 2010). The species tree was drawn using the Interactive Tree of Life (Letunic and Bork 2007). Abbreviations for the strain names are listed in Supplemental Table S1. Four phylogenetically diverse strains which were mapped and compared by transcriptome architectures are colored in red (Pfu, Pyrococcus furiosus DSM 3638; Sso, Sulfolobus solfataricus P2; Mmp, Methanococcus maripaludis S2; Hsa, Halobacterium salinarum NRC-1). (B) Plot of optimal growth temperature [data from Prokaryotic Growth Temperature Database (Huang et al. 2004)] versus proportion of operon genes of each of 65 archaeal genomes. Color symbols denote different phyletic classes [green triangle down, Euryarchaeota—Halobacteria; yellow circle, Euryarchaeota—Methanogens (Methanobacteria, Methanococci, Methanomicrobia, and Methanopyri); blue triangle up, Euryarchaeota—hyperthermophiles (Thermococci); pink star, Crenarchaeota—Hyperthermophiles (Thermoprotei); gray diamond, Nanoarchaeota and Euryarchaeota—Archaeoglobi, Thermoplasmata]. (C) Classification of 100 conserved operons in the four extremophiles.
Figure 2.
Figure 2.
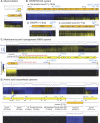
Examples of dynamic changes in transcriptome architecture of M. maripaludis S2. The tiling array data were plotted against coordinates on the genome, and transcriptional units discovered by the automated segmentation approach were manually inspected and curated through interactive exploration in the Gaggle Genome Browser (Bare et al. 2010). Genes in the forward and reverse strands are shown in yellow and orange, respectively. Corresponding transcriptome architecture (TA) data are aligned above forward strand genes and below reverse strand genes. The blue horizontal bars represent probe intensity (log2 scale) at the corresponding genomic location for reference RNA, which was prepared from a mid-log phase culture. The overlaid red line is a model fit by a segmentation algorithm that was applied to determine breaks in transcript signals (i.e., TSSs and TTSs). The heat map indicates transcript level changes at eight time points over various phases of growth in batch culture ratios (log2 scale) relative to reference RNA (blue is down-regulated; yellow up-regulated). (A) Multiple TSSs. Transcription is initiated at two sites (blue bent arrows) upstream of the glnK1-amtB operon, which encodes nitrogen regulatory protein P-II and an ammonium transporter, respectively. Interestingly, one of these TSSs (76504) was discovered using primer extension, and the TSSs mapped by the two independent methodologies mapped within one nucleotide of each other. This example illustrates the power of global analysis in comprehensive analysis of TA. (B) Conditional operon. Analysis of predicted operon structures identifies unexpected conditional breaks in the organization of the operon during cellular responses in differing environments. The mechanisms for a broken operon could include conditional activation of internal promoters or terminators, or conditional cleavage and processing. We show one example of a conditional operon for three DNA repair genes uvrABC. (C) Discovery of a new gene. We have discovered at least 63 transcripts in genomic locations that were not assigned to any annotated features. Here, we show an example of a newly discovered transcript that encodes a protein homologous to a hypothetical protein from Methanococcus maripaludis C6 (E-value = 2 × 10⁻¹³). (D) Discovery of an antisense ncRNA. At least 28 antisense ncRNAs were discovered. The example shown is for an ncRNA that is antisense to the 5′ end of MMP0591. (E) Discovery of fully overlapping genes. We have identified transcription of the antisense strand of MMP1636 encoding a major facilitator transporter. This newly discovered gene is interspersed between and cotranscribed with MMP1635, a redox-active disulfide protein, and MMP1637, a hypothetical protein.
Figure 3.
Figure 3.
Examples of dynamic changes in transcriptome architecture of P. furiosus DSM 3638. (A) Identification of misannotation. While there was no transcription of the hypothetical protein-coding gene PF0736.1n (P_expressed = 0.16), a transcript was detected from the opposite strand and assigned to a new putative gene encoding a 74-amino acid (aa)-long protein. It should be noted that PF0736.1n was previously believed to be a bona fide gene based on RNA hybridization to a PCR-based double-stranded microarray (Poole et al. 2005). This example showcases the value of strand-specific analysis. (B) CRISPR/CAS system. In the Pyrococcus CRISPR-Cas system, the guide crRNAs were suggested to be processed and translocated to the Cmr complex by the ribonuclease Cas6. (a) We detected separate TUs for each cas6 and cmr gene cluster. (b) The relative change in these transcripts was highly correlated with changes in all seven CRISPR elements and a large number of computationally predicted small nucleolar RNAs (snoRNAs) (r > 0.9). Unexpectedly, the adjacent core cas genes (cas1, cas4, cas5t, cas6) and other cas genes (cst1 and cst2) had different transcriptional profiles, suggesting conditionally activated transcriptional elements within this operon. (c) While the core cas gene cluster at locus #1 was down-regulated throughout growth in batch culture, the cas genes at locus #2 were up-regulated (r ∼ 0.4). (C) Conditional regulation of MBH operon. Segmentation analysis identified three alternative TSSs: The first was located upstream of mbh1-9, an operon that encodes subunits of a putative Na+/H+ antiporter; the second was located upstream of mbh10-12 (hydrogenase 3 complex subunits [hycG and hycE]), and the third was located upstream of mbh13-14 (hycD and hycF). Interestingly, these TUs separate the transcription of membrane-associated proteins encoded by Mbh1-9 from the cytoplasmic proteins encoded by Mbh10-12 (Holden et al. 2001). We detected at least two ncRNAs that were antisense to the MBH operon; the ncRNA located at the 3′ end of the MBH operon was correlated with surR (r = 0.95). The location of the TSS for mbh1 detected by the segmentation analysis mapped to within 19 nt of the TSS that was previously determined by primer extension (Lipscomb et al. 2009). We also observed that the TSS for PF1422 was located 40 nt inside the coding sequence; notably, there is a start codon immediately internal to this TSS, suggesting that the originally assigned start codon for this gene is incorrect. (D) Amino acid biosynthesis operons. A distinguishing feature of Pfu is the clustering of amino acid biosynthesis operons (leucine, arginine, aromatic amino acids, tryptophan) in a contiguous stretch (34 kb, 1560860–1594957). Genes in the forward and reverse strands are shown in yellow and orange, respectively. Gene boundary is indicated with a dotted line when adjacent genes are overlapping and with a solid line if there is space between genes. Numbers below or above the arrows denote the positive intergenic distances. See Figure 2 for additional keys to interpreting notations in this figure. Examples of dynamic changes in TA of Sso can be found in Supplemental Material, and TA of Hsa has been reported in our previous publication (Koide et al. 2009).
Figure 4.
Figure 4.
Reorganization events within highly conserved operons. Operons for ribosomal proteins (A), ATP synthase (B), oligo/dipeptide transporter (C), hydrogenase (D), and RAMP module Cas proteins (E). Homologous genes are shown in the same color; red shaded genes do not have orthologs in the other three archaea. Arrows above the operons indicate direction and span of TUs determined in this study. The different arrow colors represent different expression patterns. For instance, secY in Mmp is transcribed as a monocistronic TU that is co-expressed with the large ribosomal operon. In contrast, secY in Sso is also transcribed as a separate TU, but its expression pattern is different from that of the large ribosomal operon. Dotted arrows indicate unexpressed ORF(s).
Figure 5.
Figure 5.
Conditional operons. (A) Conditional operons were discovered by integrating two scores: tiling score and expression correlation. “Tiling score” indicates uniformity of raw signal intensity of probes tiled across the entire operon; “expression correlation” was calculated from expression data from studies that probed responses of these organisms to a diverse set of environmental perturbations. Conditional operons in this bivariate “conditional operon plot” were identified previously in Hsa by extensive manual inspection (green circles) and used to train a classification model which separated conditional operons (red points) from canonical operons (black dots) (Koide et al. 2009). Our classifier accurately identified nearly all manually curated operons with conditional behavior. We have used the same classification criteria previously learned on Hsa to discover conditional operons in Mmp, Sso, and Pfu. (B) Plot of proportion of conditional operons versus proportion of fully conserved operons. (C) Plot of proportion of conditional operons versus proportion of relative stability of operons of each organism. Relative stability of operon was estimated using a previously published method (Itoh et al. 1999). Briefly, under the assumption of independent destruction of operon structures, comparison of operon structures in genome 1 with those of genomes 2 and 3 led to calculation of relative stabilities of operons in strain 2 and 3. Error bars represent the standard error in six values from multiple comparisons.
Figure 6.
Figure 6.
The role of parallel evolution of TA in buffering intermediate genome organization states during formation, disruption, and reorganization of operons. (A) Operon formation. The assembly of functionally linked genes occurs through genome organizational events that bring them into close proximity. Parallel evolution of the TA via spontaneous mutations modifies transcriptional signals in the form of generating new transcriptional elements (TSSs or TTSs) or killing existing elements to generate polycistronic transcripts. Some internal transcriptional elements are retained and used in a conditional manner (i.e., triggered or silenced as a function of environmental context) to accommodate alternate regulatory schemes in certain environments. Needless to say, all of these events are driven by natural selection as genome streamlining [assembly of genes into operons to increase coding density and deletion of unnecessary genomic elements (coding and noncoding)] is associated with gain of fitness over competition. (B) Operon disruption and reorganization. While the random nature of genome shuffling allows organisms to continually explore novel fitness landscapes in changing environments, it can also be detrimental as it results in disruption of existing operon structures more often than yielding new beneficial arrangements. The parallel evolution of TA continues to buffer the intermediate genome states by restoring coordinate transcriptional control of functionally linked genes (indicated in the examples illustrating insertion and inversion events). However, occasionally this dynamic process allows for the evolution of new regulatory schema as illustrated in the second example of a translocation or split event. We have provided specific examples as evidence to support the proposed model.

Similar articles

Cited by

References

    1. Altschul SF, Madden TL, Schaffer AA, Zhang J, Zhang Z, Miller W, Lipman DJ 1997. Gapped BLAST and PSI-BLAST: A new generation of protein database search programs. Nucleic Acids Res 25: 3389–3402 - PMC - PubMed
    1. Baliga NS, Kennedy SP, Ng WV, Hood L, DasSarma S 2001. Genomic and genetic dissection of an archaeal regulon. Proc Natl Acad Sci 98: 2521–2525 - PMC - PubMed
    1. Baliga NS, Pan M, Goo YA, Yi EC, Goodlett DR, Dimitrov K, Shannon P, Aebersold R, Ng WV, Hood L 2002. Coordinate regulation of energy transduction modules in Halobacterium sp. analyzed by a global systems approach. Proc Natl Acad Sci 99: 14913–14918 - PMC - PubMed
    1. Baliga NS, Bonneau R, Facciotti MT, Pan M, Glusman G, Deutsch EW, Shannon P, Chiu Y, Weng RS, Gan RR, et al. 2004. Genome sequence of Haloarcula marismortui: A halophilic archaeon from the Dead Sea. Genome Res 14: 2221–2234 - PMC - PubMed
    1. Bapteste E, Brochier C, Boucher Y 2005. Higher-level classification of the Archaea: Evolution of methanogenesis and methanogens. Archaea 1: 353–363 - PMC - PubMed

Publication types

Substances

Associated data