. 2011 Oct;21(10):1757-67.
doi: 10.1101/gr.121541.111. Epub 2011 Jul 12.

Open chromatin defined by DNaseI and FAIRE identifies regulatory elements that shape cell-type identity

Affiliations

Open chromatin defined by DNaseI and FAIRE identifies regulatory elements that shape cell-type identity

Lingyun Song et al. Genome Res. 2011 Oct.

Abstract

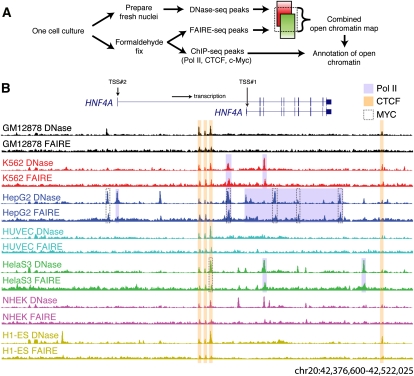
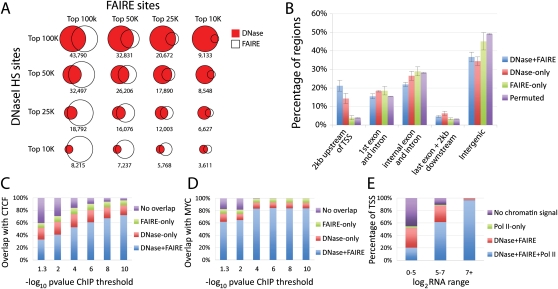
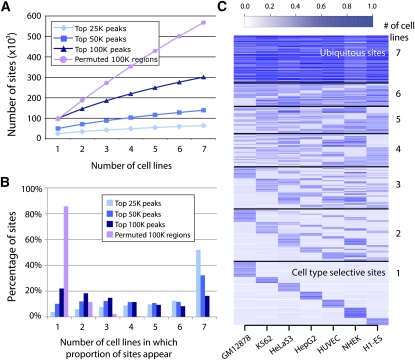
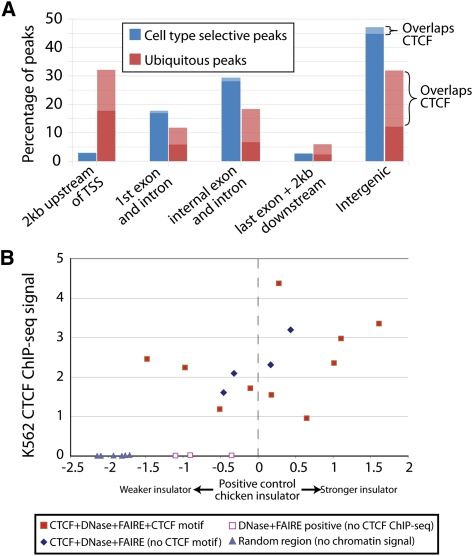
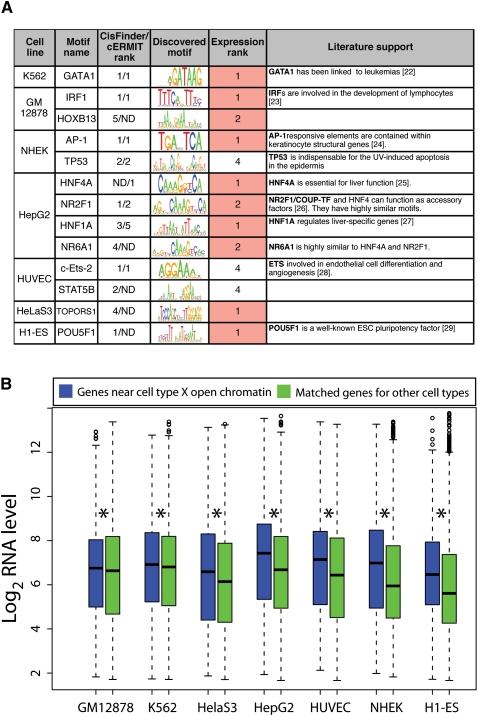
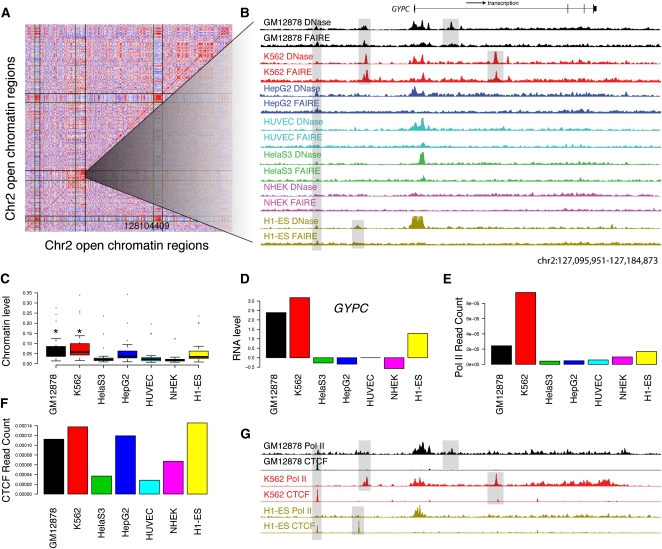
The human body contains thousands of unique cell types, each with specialized functions. Cell identity is governed in large part by gene transcription programs, which are determined by regulatory elements encoded in DNA. To identify regulatory elements active in seven cell lines representative of diverse human cell types, we used DNase-seq and FAIRE-seq (Formaldehyde Assisted Isolation of Regulatory Elements) to map "open chromatin." Over 870,000 DNaseI or FAIRE sites, which correspond tightly to nucleosome-depleted regions, were identified across the seven cell lines, covering nearly 9% of the genome. The combination of DNaseI and FAIRE is more effective than either assay alone in identifying likely regulatory elements, as judged by coincidence with transcription factor binding locations determined in the same cells. Open chromatin common to all seven cell types tended to be at or near transcription start sites and to be coincident with CTCF binding sites, while open chromatin sites found in only one cell type were typically located away from transcription start sites and contained DNA motifs recognized by regulators of cell-type identity. We show that open chromatin regions bound by CTCF are potent insulators. We identified clusters of open regulatory elements (COREs) that were physically near each other and whose appearance was coordinated among one or more cell types. Gene expression and RNA Pol II binding data support the hypothesis that COREs control gene activity required for the maintenance of cell-type identity. This publicly available atlas of regulatory elements may prove valuable in identifying noncoding DNA sequence variants that are causally linked to human disease.


Figures

Figure 1.
Figure 1.
Identification of open chromatin in seven human cell lines. (A) A schematic representation of the experiment and analysis design. (B) DNaseI (y-axis fixed at Parzen signal value 0.15) and FAIRE (y-axis fixed at 0.04) data from seven cell lines surrounding the HNF4A locus (145 kb; UCSC Genome Browser) shows both ubiquitous and cell-type selective open sites that are especially prevalent in HepG2 cells. Pol II, CTCF, and MYC ChIP-seq peaks that overlap open chromatin are highlighted.
Figure 2.
Figure 2.
DNase-seq and FAIRE-seq identify overlapping and unique sets of open chromatin. (A) Comparisons of the top 10K, 25K, 50K, and 100K DNase-seq and FAIRE-seq peaks from a single cell line (GM12878), with overlap indicated below each Venn diagram. (B) Average percentage of DNaseI and/or FAIRE peaks, as well as permuted coordinates, in defined positional categories based on their relationship to annotated genes. Error bars represent the standard deviation over seven cell types. Several categories deviated significantly from random (Supplemental Table S2). (C) The percentage of CTCF ChIP-seq peaks that overlap DNaseI and/or FAIRE sites in all seven cell types. The x-axis values indicate different signal thresholds for calling sets of CTCF peaks, where the threshold is increasingly more stringent from left to right. (D) The same as C, except for MYC ChIP-seq data. (E) Percentage of TSSs with overlapping Pol II ChIP-seq, DNaseI, and/or FAIRE peaks in seven cell types. x-axis represents expression values for corresponding genes indicating high (7+), medium (5–7), or low/no (0–5) expression.
Figure 3.
Figure 3.
Distribution of open chromatin regions across cell types. (A) Saturation of total open chromatin sites discovered as a function of the number of cell types tested (x-axis). The rate of new top 25K sites per cell type was lower than for top 50K and 100K sites, likely reflecting more ubiquitous sites in this top fraction. (B) Percentage of the top 25K, 50K, and 100K combined open chromatin sites (y-axis) detected in one to seven of the cell types tested (x-axis). Over 50% of the top 25K open chromatin sites were ubiquitous, while more top 50K and 100K peaks were cell type selective. (C) Top 100K combined open chromatin sites partitioned by number of cell types in which they appear (y-axis). Color intensity indicates strength of open chromatin signal in that cell type.
Figure 4.
Figure 4.
Ubiquitous and cell-type selective sites differ related to transcription start sites and presence of CTCF. (A) Percentage of ubiquitous and cell-type selective open chromatin sites in positional categories relative to annotated genes. Light bars represent open sites overlapping CTCF. (B) Insulator assays performed on sites with (1) DNase-seq, FAIRE-seq, and CTCF ChIP-seq signal and a CTCF motif (filled red squares); (2) signal in all three assays but without a CTCF motif (blue diamonds); (3) DNase-seq and FAIRE-seq signal, but not CTCF ChIP-seq (open red squares); and (4) no signal in any assay (gray triangles). y-axis indicates the signal from CTCF ChIP-seq in K562 cells. Enhancer blocking values (x-axis) were calculated as described (Supplemental Methods), with a value of zero equaling the measured activity of a known insulator.
Figure 5.
Figure 5.
Distal cell-type selective open chromatin contains functionally relevant motifs and is linked to cell-type specific expression. (A) Top motifs enriched (P-value < 1 × 10⁻⁹) in cell-type selective open chromatin. Expression rank reflects the transcription factor's expression level in that cell type relative to all other cell types. (B) Distribution of expression values for genes closest to distal cell-type selective open chromatin sites (>2 kb from a TSS) from each cell type (x-axis) for that cell type (blue box plots). Similar distributions were calculated for these genes in the six other cell types lacking the distal open chromatin sites (green box plots). Asterisk indicates significant difference (pairwise T-tests).
Figure 6.
Figure 6.
Open chromatin patterns form clusters of open regulatory elements (COREs). (A) Pairwise correlations between 500 open chromatin sites from chromosome 2 show three blocks of correlated sites (see Methods). Each row and column represents an open chromatin region found by both DNase-seq and FAIRE-seq in at least one of the seven cell types. Red indicates high correlation, white indicates no correlation, and blue indicates negative correlation. Vertical and horizontal lines show CORE boundaries. (B) DNase-seq (y-axis fixed at 0.1) and FAIRE-seq (y-axis fixed at 0.04) signals for a 90-kb subsection of CORE 98 containing the GYPC gene. GYPC is the only gene in this CORE. Highlighted are open chromatin sites found in all cell types, only GM12878 and K562 together, and GM12878 and K562 individually. (C) Boxplots show the distributions of open chromatin levels within open chromatin sites with CORE 98. GM12878 and K562 both have significantly higher levels of open chromatin (*; Mann-Whitney Wilcoxon rank sum test). (D) Relative expression levels (y-axis) of GYPC show increased expression in GM12878 and K562 cell lines. (E) Open chromatin sites within CORE 98 also show higher normalized Pol II ChIP-seq read counts in GM12878 and K562 cell types. (F) Normalized CTCF ChIP-seq read counts do not show significant differences between GM12878 and K562 and other cell types CORE98. (G) Pol II and CTCF signals in this 90-kb region (shown in B) provide preliminary annotations of similar and differential open chromatin sites.

References

    1. Bell AC, West AG, Felsenfeld G 1999. The protein CTCF is required for the enhancer blocking activity of vertebrate insulators. Cell 98: 387–396 - PubMed
    1. Bhinge AA, Kim J, Euskirchen GM, Snyder M, Iyer VR 2007. Mapping the chromosomal targets of STAT1 by Sequence Tag Analysis of Genomic Enrichment (STAGE). Genome Res 17: 910–916 - PMC - PubMed
    1. Bolotin E, Liao H, Ta TC, Yang C, Hwang-Verslues W, Evans JR, Jiang T, Sladek FM 2010. Integrated approach for the identification of human hepatocyte nuclear factor 4alpha target genes using protein binding microarrays. Hepatology 51: 642–653 - PMC - PubMed
    1. Boyle AP, Davis S, Shulha HP, Meltzer P, Margulies EH, Weng Z, Furey TS, Crawford GE 2008a. High-resolution mapping and characterization of open chromatin across the genome. Cell 132: 311–322 - PMC - PubMed
    1. Boyle AP, Guinney J, Crawford GE, Furey TS 2008b. F-Seq: A feature density estimator for high-throughput sequence tags. Bioinformatics 24: 2537–2538 - PMC - PubMed

Associated data