. 2011 Oct;21(10):1563-71.
doi: 10.1101/gr.118638.110. Epub 2011 Jul 12.

Loss of exon identity is a common mechanism of human inherited disease

Affiliations

Loss of exon identity is a common mechanism of human inherited disease

Timothy Sterne-Weiler et al. Genome Res. 2011 Oct.

Abstract

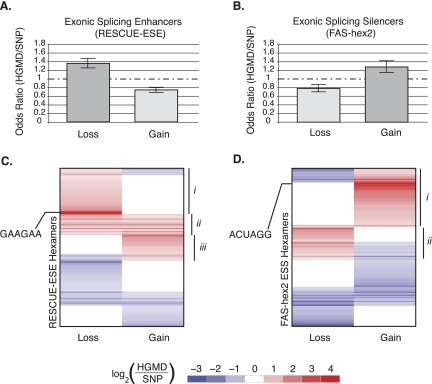
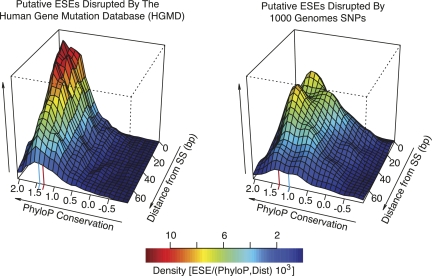
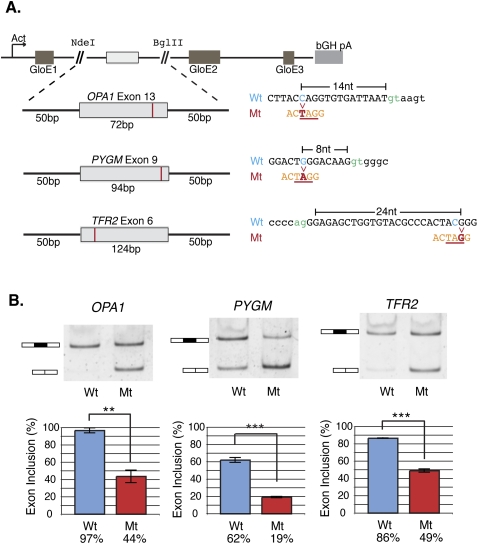
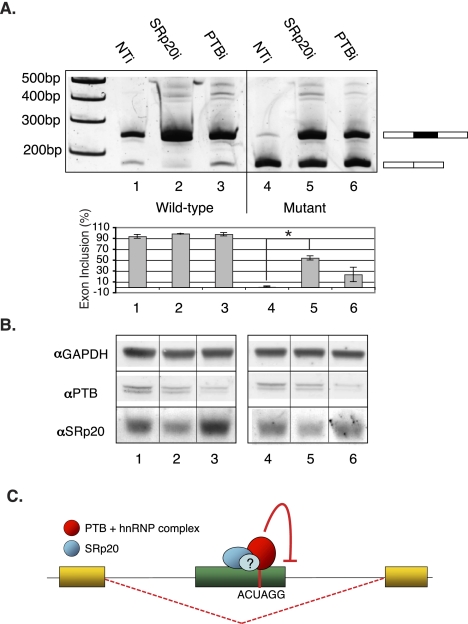
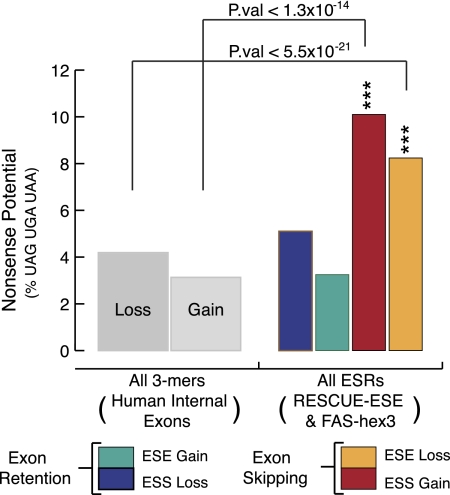
It is widely accepted that at least 10% of all mutations causing human inherited disease disrupt splice-site consensus sequences. In contrast to splice-site mutations, the role of auxiliary cis-acting elements such as exonic splicing enhancers (ESE) and exonic splicing silencers (ESS) in human inherited disease is still poorly understood. Here we use a top-down approach to determine rates of loss or gain of known human exonic splicing regulatory (ESR) sequences associated with either disease-causing mutations or putatively neutral single nucleotide polymorphisms (SNPs). We observe significant enrichment toward loss of ESEs and gain of ESSs among inherited disease-causing variants relative to neutral polymorphisms, indicating that exon skipping may play a prominent role in aberrant gene regulation. Both computational and biochemical approaches underscore the relevance of exonic splicing enhancer loss and silencer gain in inherited disease. Additionally, we provide direct evidence that both SRp20 (SRSF3) and possibly PTB (PTBP1) are involved in the function of a splicing silencer that is created de novo by a total of 83 different inherited disease mutations in 67 different disease genes. Taken together, we find that ~25% (7154/27,681) of known mis-sense and nonsense disease-causing mutations alter functional splicing signals within exons, suggesting a much more widespread role for aberrant mRNA processing in causing human inherited disease than has hitherto been appreciated.


Figures

Figure 1.
Figure 1.
Patterns of exonic splicing regulator loss or gain among pathological mutations (HGMD) as compared to putatively neutral SNPs. (A,B) Bar height corresponds to the odds ratio (OR) of HGMD/SNPs for the loss or gain of enhancers and silencers, respectively. Each error bar represents a two-tailed 95% confidence interval for the bar height (see Methods). Directionality was expressed in the form of the ancestral state > variant for the SNPs and healthy > disease for the HGMD mutations. (A) Hexamers corresponding to exonic splicing enhancers were obtained from the RESCUE-ESE database. Each hexamer was scored for the loss or gain (de novo creation) of an ESE by the inherited disease-causing mutations (relative to the wild-type allele) or putatively neutral SNPs (relative to the ancestral allele). (B) Hexamers corresponding to exonic splicing silencers were obtained from the FAS-hex2 database and scored for loss or gain as described in A. (C,D) Principal component analysis (PCA) of normalized ratios of HGMD versus SNP substitution for loss or gain of ESE and ESS hexamers, respectively. Each row corresponds to a single ESE or ESS hexamer, whereas each column represents loss or gain of the hexamer by a genomic variant. Any hexamers that were not significant at the 5% level were omitted from the heat map. Each box depicts the log ratio for the counts of HGMD/SNP causing loss or gain of a specific hexamer. A positive log ratio in red corresponds to a hexamer in a certain context (column) that is significantly enriched in inherited disease. Alternatively, a blue value represents a hexamer that is polymorphic across human populations. White boxes correspond to non-significant P-values given a false discovery rate (FDR) of 5%. (C) Hexamer clusters corresponding to ESE-loss (region i), ESE-loss and ESE-gain (region ii), and ESE-gain (region iii). Hexamer clusters corresponding to ESS-gain (region i) and ESS-loss (region ii). The loss/gain of SRSF1-like binding sites is indicated by GAAGAA in C, whereas the ACUAGG hexamer is indicated in D.
Figure 2.
Figure 2.
Conservation of exonic splicing enhancers ablated by genomic variants. The two-dimensional density distributions (relative values given in color scale) of ESEs containing associated average phyloP (Pollard et al. 2009) scores and distances to the nearest splice site (3–72 bp). The density distributions for ESEs targeted for loss by inherited disease-causing (HGMD) mutations (left panel) or neutral SNPs (right panel). In each panel the red line designates a phyloP score corresponding to a P-value of 0.05. The blue line designates the median phyloP score of each density distribution.
Figure 3.
Figure 3.
Validation of mutations creating the enriched silencer ACUAGG using the beta-globin splicing reporter. (A) Splicing reporter constructs created from matched pairs of wild-type (Wt) or mutant (Mt) alleles that give rise to a gain of the ACUAGG silencer in constitutive exons in three different disease genes: OPA1, PYGM, and TFR2. GloE1, GloE2, and GloE3 designate exons 1–3 of beta-globin. The polyadenylation signal from the bovine growth hormone 1 gene is indicated by bGH pA. (Blue) Wild-type allele; (red) the mutant; (orange) the silencer sequence created by the mutation. (B) HeLa cells were transiently transfected in triplicate with both wild-type (Wt) and mutant (Mt) alleles. Twenty-four hours after transfection, cells were treated with emetine to inhibit NMD, RNA was harvested, and the splicing efficiency was determined by RT-PCR and visualized using 6% non-denaturing (29:1) polyacrylamide gel electrophoresis (PAGE). The graphs depict mean exon inclusion quantified using an Agilent 2100 Bioanalyzer with standard error bars (see Methods). Statistical hypothesis testing on means was executed using a Welch t-test for normal data with unequal sample size and variance using α-values of (*) 0.05, (**) 0.01, and (***) 0.001.
Figure 4.
Figure 4.
Identification of trans-acting factors implicated in skipping of the ACUAGG-containing OPA1 allele. (A) RT-PCR analysis of OPA1 splicing reporters from HeLa cells cotransfected with non-targeting siRNA (NTi), SRSF3 siRNA (SRp20i), PTBP1 siRNA (PTBi). Lanes 1–3 and 4–6, wild-type and mutant reporters, respectively. Statistical hypothesis testing on means was executed using a Welch t-test for normal data with unequal sample size and variance using α-values of (*) 0.05, (**) 0.01, and (***) 0.001. (B) Western blot showing relative depletion of SRp20 and PTB as compared to the GAPDH loading control. (C) Model for aberrant splicing by “ACUAGG” ESS. A point mutation creating the sequence ACUAGG results in recruitment of a silencer complex that may contain SRp20 and members of the hnRNP protein family, either directly or indirectly bound to the RNA sequence. The complex is involved in deterring inclusion of the mutant exon via mechanism(s) that still remain to be determined.
Figure 5.
Figure 5.
An overview of the nonsense codon sequence bias in exonic splicing regulators. Bars correspond to the nonsense-coding potential of ESR loss or gain, the proportion (expressed as a percentage) of 3-mers matching UAG, UGA, or UAA out of total 3-mers. For ESR loss, this was calculated via simulated mutation based on HGMD transition/transversion probabilities (Supplemental Fig. 2). For all human internal exonic 3-mers, the nonsense-coding potential was calculated using the same algorithm as the ESRs, except using a set of all human internal exonic sequences instead of ESR hexamers. The frequencies were normalized, and the values for the data given for ESR loss or gain were analyzed statistically (P-values from χ2 goodness-of-fit test) using an α-value of (***) 0.001.

Similar articles

Cited by

References

    1. Barash Y, Calarco JA, Gao W, Pan Q, Wang X, Shai O, Blencowe BJ, Frey BJ 2010. Deciphering the splicing code. Nature 465: 53–59 - PubMed
    1. Benjamini Y, Hochberg Y 1995. Controlling the false discovery rate: A practical and powerful approach to multiple testing. J R Stat Soc Ser B Methodol 57: 289–300
    1. Biasiotto G, Camaschella C, Forni GL, Polotti A, Zecchina G, Arosio P 2008. New TFR2 mutations in young Italian patients with hemochromatosis. Haematologica 93: 309–310 - PubMed
    1. Boffelli D, McAuliffe J, Ovcharenko D, Lewis KD, Ovcharenko I, Pachter L, Rubin EM 2003. Phylogenetic shadowing of primate sequences to find functional regions of the human genome. Science 299: 1391–1394 - PubMed
    1. Bruno C, Tamburino L, Kawashima N, Andreu AL, Shanske S, Hadjigeorgiou GM, Kawashima A, DiMauro S 1999. A nonsense mutation in the myophosphorylase gene in a Japanese family with McArdle's disease. Neuromuscul Disord 9: 34–37 - PubMed

Publication types