

Fluoroestradiol positron emission tomography reveals differences in pharmacodynamics of aromatase inhibitors, tamoxifen, and fulvestrant in patients with metastatic breast cancer
- PMID: 21750198
- PMCID: PMC3139698
- DOI: 10.1158/1078-0432.CCR-10-3321
Fluoroestradiol positron emission tomography reveals differences in pharmacodynamics of aromatase inhibitors, tamoxifen, and fulvestrant in patients with metastatic breast cancer
Abstract
Purpose: To determine, by molecular imaging, how in vivo pharmacodynamics of estrogen-estrogen receptor (ER) binding differ between types of standard endocrine therapy.
Experimental design: The ER has been a highly successful target for breast cancer treatment. ER-directed treatments include lowering ligand concentration by using aromatase inhibitors (AI) and blocking the receptor with agents like tamoxifen (TAM) or fulvestrant (FUL). We measured regional estrogen-ER binding by using positron emission tomography with (18)F-fluoroestradiol (FES PET) prior to and during treatment with AI, TAM, or FUL in a series of 30 metastatic breast cancer patients. FES PET measured in vivo estrogen binding at all tumor sites in heavily pretreated women with metastatic bone soft tissue-dominant breast cancer. In patients with uterus (n = 16) changes in uterine FES uptake were also measured.
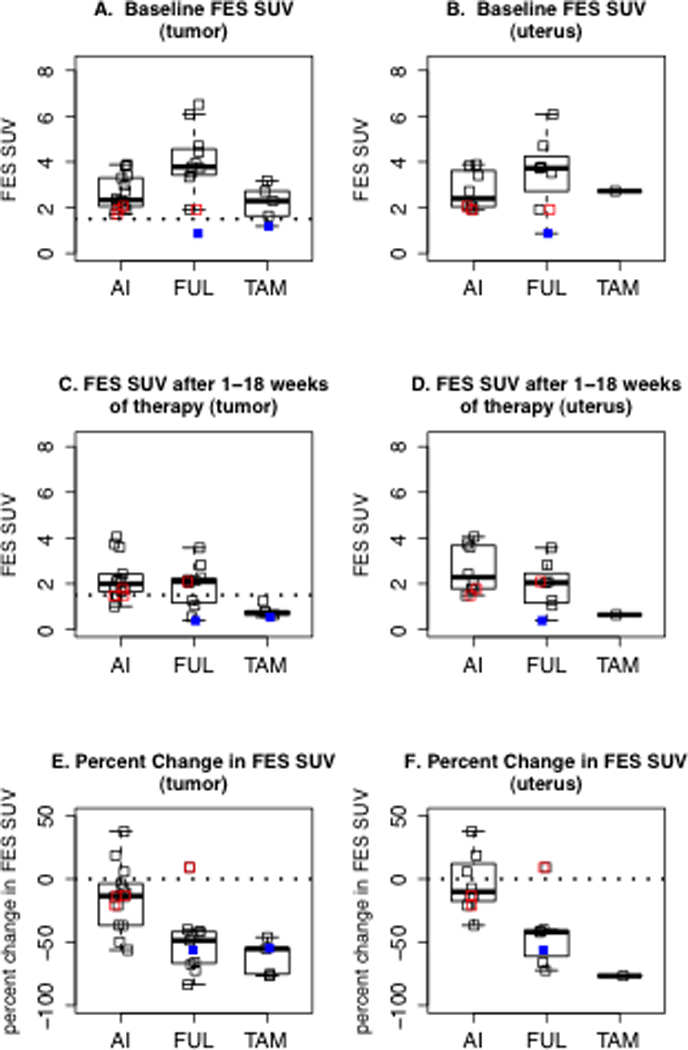
Results: As expected, tumor FES uptake declined more markedly on ER blockers (TAM and FUL, average 54% decline) compared with a less than 15% average decline on estrogen-depleting AIs (P < 0.001). The rate of complete tumor blockade [FES standardized uptake value (SUV) ≤1.5] following TAM (5/5 patients) was greater than the blockade rate following FUL (4/11; 2-sided mid P = 0.019). Percent FES SUV change in the uterus showed a strong association with tumoral change (ρ = 0.63, P = 0.01).
Conclusions: FES PET can assess the in vivo pharmacodynamics of ER-targeted agents and may give insight into the activity of established therapeutic agents. Imaging revealed significant differences between agents, including differences in the efficacy of blockade by different ER antagonists in current clinical use.
Figures

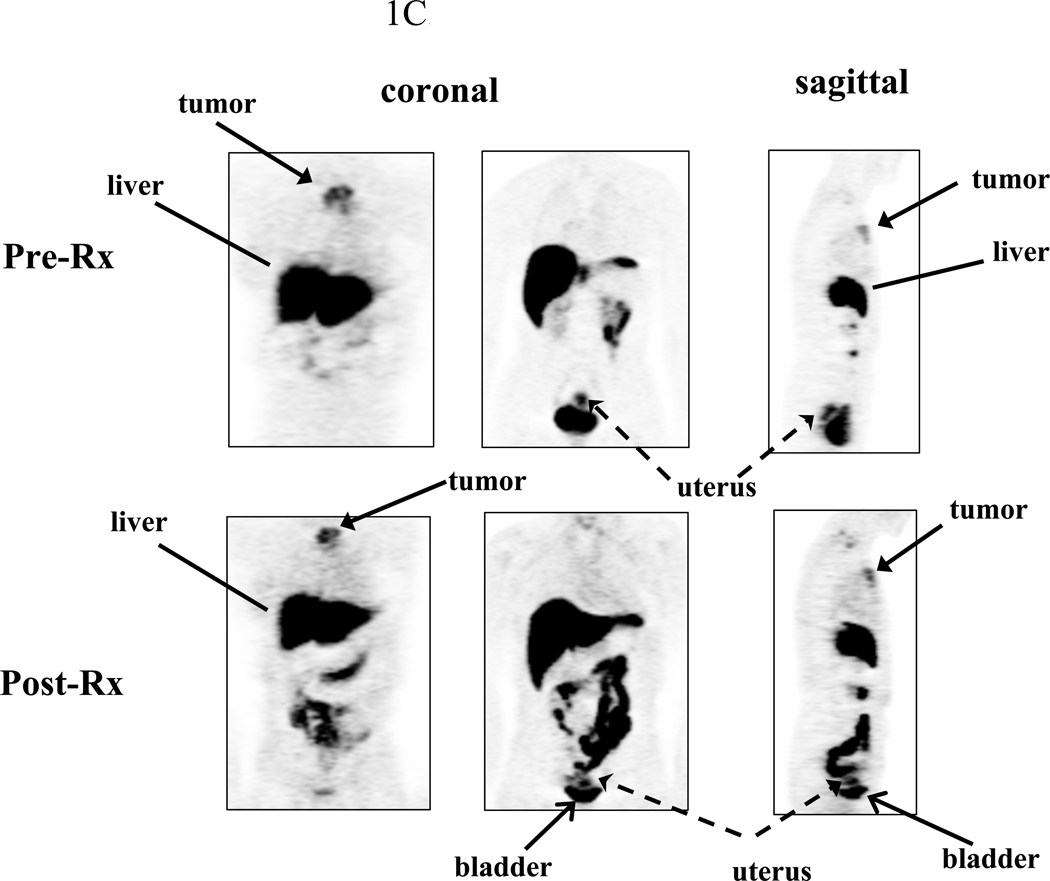
Tumor in the upper spine shows baseline uptake and complete ER blockade in tumor and uterus following 21 days of TAM
Tumor in mediastinal nodes shows baseline uptake and incomplete ER blockade in tumor and uterus following 68 days of FUL.
Sternal tumor shows ER uptake, and no blockade in the tumor and uterus following 29 days of letrozole (AI).
References
-
- Iwase H. Current topics and perspectives on the use of aromatase inhibitors in the treatment of breast cancer. Breast Cancer. 2008;15:278–290. - PubMed
-
- Brodie AH, Jelovac D, Long B. The intratumoral aromatase model: studies with aromatase inhibitors and antiestrogens. J Steroid Biochem Mol Biol. 2003;86:283–288. - PubMed
-
- Bhatnagar AS, Brodie AM, Long BJ, Evans DB, Miller WR. Intracellular aromatase and its relevance to the pharmacological efficacy of aromatase inhibitors. J Steroid Biochem Mol Biol. 2001;76:199–202. - PubMed
-
- Chung CT, Carlson RW. The role of aromatase inhibitors in early breast cancer. Curr Treat Options Oncol. 2003;4:133–140. - PubMed
-
- Lonning PE, et al. High-dose estrogen treatment in postmenopausal breast cancer patients heavily exposed to endocrine therapy. Breast Cancer Res Treat. 2001;67:111–116. - PubMed
Publication types
MeSH terms
Substances
Grants and funding
LinkOut - more resources
Full Text Sources
Medical
Research Materials
Miscellaneous
