

The genetic relationships between ethanol preference, acute ethanol sensitivity, and ethanol tolerance in Drosophila melanogaster
- PMID: 21750412
- PMCID: PMC3225762
- DOI: 10.4161/fly.5.3.16987
The genetic relationships between ethanol preference, acute ethanol sensitivity, and ethanol tolerance in Drosophila melanogaster
Abstract
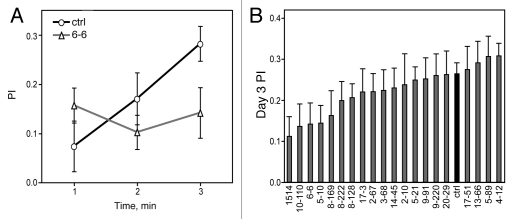
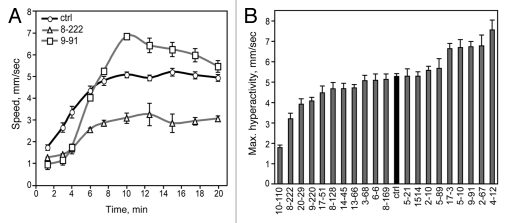
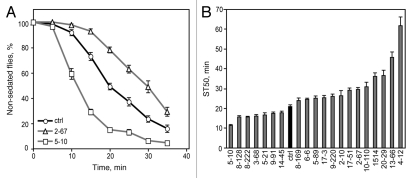
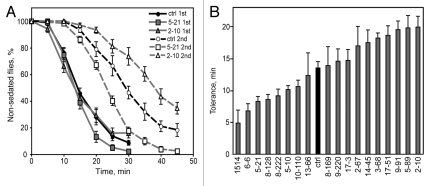
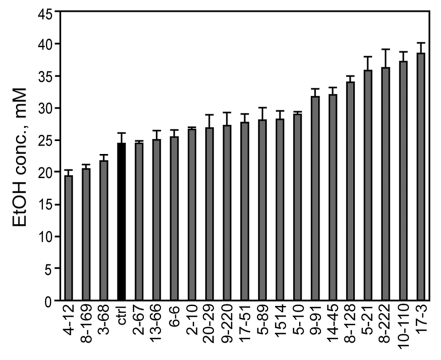
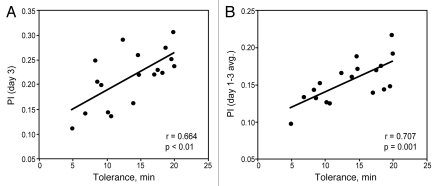
The relationship between alcohol consumption, sensitivity, and tolerance is an important question that has been addressed in humans and rodent models. Studies have shown that alcohol consumption and risk of abuse may correlate with (1) increased sensitivity to the stimulant effects of alcohol, (2) decreased sensitivity to the depressant effects of alcohol, and (3) increased alcohol tolerance. However, many conflicting results have been observed. To complement these studies, we utilized a different organism and approach to analyze the relationship between ethanol consumption and other ethanol responses. Using a set of 20 Drosophila melanogaster mutants that were isolated for altered ethanol sensitivity, we measured ethanol-induced hyperactivity, ethanol sedation, sedation tolerance, and ethanol consumption preference. Ethanol preference showed a strong positive correlation with ethanol tolerance, consistent with some rodent and human studies, but not with ethanol hyperactivity or sedation. No pairwise correlations were observed between ethanol hyperactivity, sedation, and tolerance. The evolutionary conservation of the relationship between tolerance and ethanol consumption in flies, rodents, and humans indicates that there are fundamental biological mechanisms linking specific ethanol responses.
Figures
Similar articles
-
Genetics and genomics of alcohol responses in Drosophila.Neuropharmacology. 2017 Aug 1;122:22-35. doi: 10.1016/j.neuropharm.2017.01.032. Epub 2017 Feb 1. Neuropharmacology. 2017. PMID: 28161376 Free PMC article. Review.
-
Convergent Evidence From Humans and Drosophila melanogaster Implicates the Transcription Factor MEF2B/Mef2 in Alcohol Sensitivity.Alcohol Clin Exp Res. 2019 Sep;43(9):1872-1886. doi: 10.1111/acer.14138. Epub 2019 Jul 16. Alcohol Clin Exp Res. 2019. PMID: 31241765 Free PMC article.
-
Preferential ethanol consumption in Drosophila models features of addiction.Curr Biol. 2009 Dec 29;19(24):2126-32. doi: 10.1016/j.cub.2009.10.070. Epub 2009 Dec 10. Curr Biol. 2009. PMID: 20005106 Free PMC article.
-
F654A and K558Q Mutations in NMDA Receptor 1 Affect Ethanol-Induced Behaviors in Drosophila.Alcohol Clin Exp Res. 2019 Dec;43(12):2480-2493. doi: 10.1111/acer.14215. Epub 2019 Nov 1. Alcohol Clin Exp Res. 2019. PMID: 31593608 Free PMC article.
-
A Brief Overview of Ethanol Tolerance and Its Potential Association with Circadian Rhythm in Drosophila.Int J Mol Sci. 2024 Nov 24;25(23):12605. doi: 10.3390/ijms252312605. Int J Mol Sci. 2024. PMID: 39684317 Free PMC article. Review.
Cited by
-
Alcohol-Induced Behaviors Require a Subset of Drosophila JmjC-Domain Histone Demethylases in the Nervous System.Alcohol Clin Exp Res. 2017 Dec;41(12):2015-2024. doi: 10.1111/acer.13508. Epub 2017 Oct 30. Alcohol Clin Exp Res. 2017. PMID: 28940624 Free PMC article.
-
Genetics and genomics of alcohol responses in Drosophila.Neuropharmacology. 2017 Aug 1;122:22-35. doi: 10.1016/j.neuropharm.2017.01.032. Epub 2017 Feb 1. Neuropharmacology. 2017. PMID: 28161376 Free PMC article. Review.
-
Large genetic analysis of alcohol resistance and tolerance reveals an inverse correlation and suggests 'true' tolerance mutants.bioRxiv [Preprint]. 2023 Oct 10:2023.10.09.561599. doi: 10.1101/2023.10.09.561599. bioRxiv. 2023. Update in: Genes Brain Behav. 2024 Feb;23(1):e12884. doi: 10.1111/gbb.12884. PMID: 37873285 Free PMC article. Updated. Preprint.
-
Drosophila melanogaster as a model to study drug addiction.Hum Genet. 2012 Jun;131(6):959-75. doi: 10.1007/s00439-012-1146-6. Epub 2012 Feb 17. Hum Genet. 2012. PMID: 22350798 Free PMC article. Review.
-
Mef2 induction of the immediate early gene Hr38/Nr4a is terminated by Sirt1 to promote ethanol tolerance.Genes Brain Behav. 2019 Mar;18(3):e12486. doi: 10.1111/gbb.12486. Epub 2018 May 28. Genes Brain Behav. 2019. PMID: 29726098 Free PMC article.
References
-
- Babor TF, Berglas S, Mendelson JH, Ellingboe J, Miller K. Alcohol, affect, and the disinhibition of verbal behavior. Psychopharmacology (Berl) 1983;80:53–60. - PubMed
-
- Kalant H. Current state of knowledge about the mechanisms of alcohol tolerance. Addict Biol. 1996;1:133–141. - PubMed
-
- Schuckit MA. Low level of response to alcohol as a predictor of future alcoholism. Am J Psychiatry. 1994;151:184–189. - PubMed
-
- Schuckit MA, Smith TL. An 8-year follow-up of 450 sons of alcoholic and control subjects. Arch Gen Psychiatry. 1996;53:202–210. - PubMed
Publication types
MeSH terms
Substances
Grants and funding
LinkOut - more resources
Full Text Sources
Medical
Molecular Biology Databases