. 2011 Jul;13(7):620-32.
doi: 10.1593/neo.11134.

Metabolic targeting of lactate efflux by malignant glioma inhibits invasiveness and induces necrosis: an in vivo study

Affiliations

Metabolic targeting of lactate efflux by malignant glioma inhibits invasiveness and induces necrosis: an in vivo study

Chaim B Colen et al. Neoplasia. 2011 Jul.

Abstract

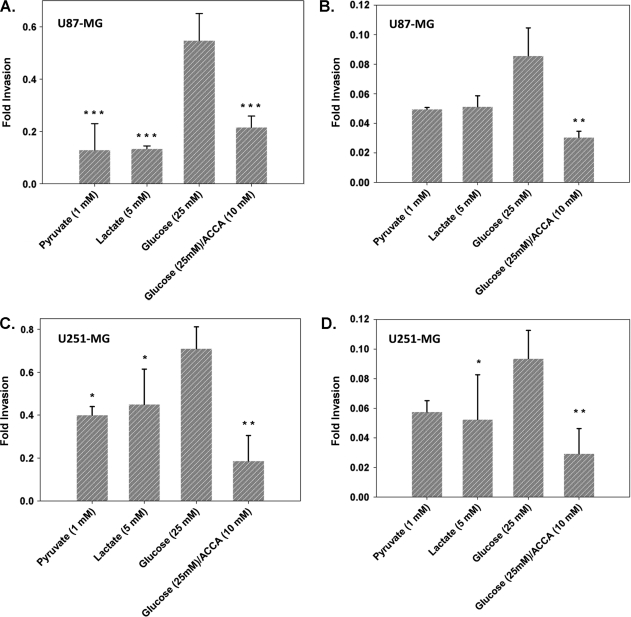
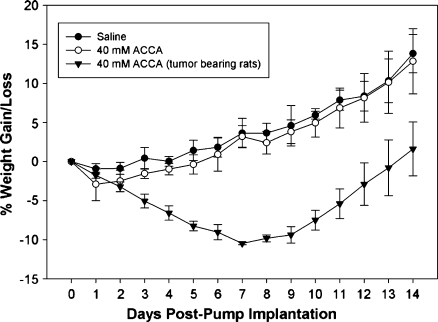
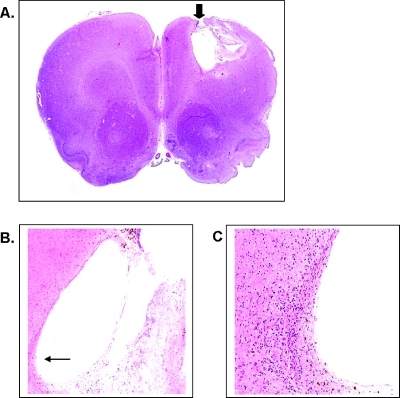
Glioblastoma multiforme (GBM) are the most malignant among brain tumors. They are frequently refractory to chemotherapy and radiotherapy with mean patient survival of approximately 6 months, despite surgical intervention. The highly glycolytic nature of glioblastomas describes their propensity to metabolize glucose to lactic acid at an elevated rate. To survive, GBMs efflux lactic acid to the tumor microenvironment through transmembrane transporters denoted monocarboxylate transporters (MCTs). We hypothesized that inhibition of MCT function would impair the glycolytic metabolism and affect both glioma invasiveness and survival. We examined the effect on invasiveness with α-cyano-4-hydroxy-cinnamic acid (ACCA, 4CIN, CHCA), a small-molecule inhibitor of lactate transport, through Matrigel-based and organotypic (brain) slice culture invasive assays using U87-MG and U251-MG glioma cells. We then conducted studies in immunodeficient rats by stereotaxic intracranial implantation of the glioma cells followed by programmed orthotopic application of ACCA through osmotic pumps. Effect on the implanted tumor was monitored by small-animal magnetic resonance imaging. Our assays indicated that glioma invasion was markedly impaired when lactate efflux was inhibited. Convection-enhanced delivery of inhibitor to the tumor bed caused tumor necrosis, with 50% of the animals surviving beyond the experimental end points (3 months after inhibitor exhaustion). Most importantly, control animals did not display any adverse neurologic effects during orthotopic administration of ACCA to brain through programmed delivery. These results indicate the clinical potential of targeting lactate efflux in glioma through delivery of small-molecule inhibitors of MCTs either to the tumor bed or to the postsurgical resection cavity.


Figures

Figure 1
Figure 1
ACCA inhibits glucose mediated glioma invasiveness across Matrigel and organotypic brain slice cultures. Migration of EGFP-expressing glioma cells across Matrigel-coated transwell inserts or across 0.5-mm-thick coronal slices from the CPu region of immunodeficient rat brains were evaluated. Invasion across Matrigel of U87-MG (A) and U251-MG (C) (n = 4 per metabolite) or across coronal brain slices of U87-MG (B) and U251-MG (D) (n = 4 per metabolite) were plotted as fold invasion. Fold invasion = fluorescence of [(transwell bottom read)/(transwell top + bottom reads)]. Data shown as mean ± SEM. P values are indicated in comparison to glucose data. ***P < .01, **.01 < P < .05, *.05 < P < .1. Unmarked data sets had .1 < P < .5.
Figure 2
Figure 2
Extracellular ACCA does not inhibit O2 consumption rate of U87-MG glioma cells. (A) Upper trace: Cells (0.5 x 10⁶) were added to DMEM/F12 medium maintained at room temperature (arrow 1) and rates of O2 consumption traced for 10 minutes; ACCA was added to 10 mM final (arrow 2) and respiration measured for another 10 minutes, followed by addition of digitonin (40 µM final). Lower trace: O2 consumption of cells incubated for a similar duration but in the absence of ACCA or digitonin. Lines A, B, and C mark the time intervals that were used to plot O2 consumption rates (n = 3) at each step (B).
Figure 3
Figure 3
Kaplan-Meier survival analysis of immunodeficient rat orthotopic glioblastoma models treated with ACCA. (A) Animals implanted with glioma in the CPu region were subjected to CED with saline (control animals; n = 3) or ACCA at the indicated concentrations (test animals; n = 3 per group) and the survival followed up to 120 days. Day 1 = day of tumor implantation. (B) A second cohort of animals that were not implanted with tumor (control; n = 3) were administered 40 mM ACCA in the CPu region through CED to test for toxicity to ACCA. Two additional groups were implanted with glioma in the CPu region (n = 6 per group) at day 1 and treated with saline (0 mM ACCA) or 40 mM ACCA through CED 14 days after tumor implantation, and survival was monitored up to 120 days after tumor implantation.
Figure 4
Figure 4
Coronal MR scans of immunodeficient rat orthotopic glioblastoma models treated with ACCA. Representative coronal MR scans of one of the six animals that survived beyond experimental end points is shown. Gadolinium contrast-enhanced images are shown at the cannulation point. (A) Day 1, immediately after implantation of tumor in the CPu region; the needle tract is indicated by arrow. (B–D) Images of the same coronal position at day 14 (day of osmotic pump implantation and cannulation of the tumor for CED of ACCA), day 56 (42 days after CED of ACCA and 14 days after exhaustion of ACCA in the osmotic pumps), and day 120 (106 days after CED of ACCA and 78 days after exhaustion of ACCA in the osmotic pump). Representative images of an animal that survived to day 120 are shown. (E) Tumor growth at day 20 in a representative animal that did not receive saline or ACCA through CED.
Figure 5
Figure 5
Percentage weight gain or loss in immunodeficient rats treated with 40 mM ACCA to the CPu region through CED. Non-tumor-bearing animals (weight, 300–350 g) were cannulated in the CPu region at the same stereotaxic location as for tumor implantation (day 0). Saline (n = 3)or 40 mMACCA (n = 3) were delivered through osmotic pumps (28-day duration pumps; 200-µl capacity) for a period of 14 days, and the animals were weighed daily. The weight gain or loss of tumor-bearing animals that were treated with 40 mM ACCA through CED are shown for comparison (n = 2; day 0 = day of administration of 40 mM ACCA through CED, 14 days after tumor implantation).
Figure 6
Figure 6
Histologic analysis of coronal sections of brains of immunodeficient rats treated with 40 mM ACCA through CED. (A) Representative H&E-stained coronal section (x10) of one of the animal brains that was evaluated for tissue necrosis at the cannulation point (cortical region; arrow) after CED of ACCA for 2 weeks. (B) Cannulation point (arrow) at x40 magnification. (C) Cannulation point at x200 magnification.
Figure 7
Figure 7
Histologic analysis of coronal sections of brains of tumor bearing rats after treatment with 40 mM ACCA through CED. (A) Representative H&E-stained coronal section (x10) of brain of one of the animals that survived beyond experimental end points. Cannulation/ posttumor necrotic tissue cavity (striatal region; arrow) 120 days after CED of ACCA. (B) Necrotic cavity (arrow) at x40 magnification. (C) Cavity wall at x200 magnification.
Figure 8
Figure 8
CED-mediated distribution of ACCA in immunodeficient rat brains. (A) Coronal brain sections, 1 mm in thickness, were obtained from animals that received 40 mM ACCA for 14 days through CED to the CPu region (non-tumor-bearing rats). Sections were weighed and processed for HPLC-MS analysis for ACCA concentration per slice. Slice 0 indicates cannulation point; slices A1–A3, anterior slices at 1-mm intervals from the cannulation point; slices P1–P3, posterior slices at 1-mm intervals from the cannulation point. (B) The ACCA concentrations (micrograms per gram of wet weight of brain) recorded were 0.195 ± 0.27 (A3), 0.0385 ± 0.54 (A2), 1.16 ± 0.06 (A1), 5.11 ± 0.24 (0), 7.21 ± 1.06 (P1), 2.52 ± 0.01 (P2), 0.595 ± 0.17 (P3).

References

    1. Warburg O, Dickens F Kaiser Wilhelm-Institut fur Biologie B, author. The Metabolism of Tumours: Investigations from the Kaiser-Wilhelm Institute for Biology, Berlin-Dahlem. London, UK: Constable & Co, Ltd; 1930.
    1. Baggetto LG. Deviant energetic metabolism of glycolytic cancer cells. Biochimie. 1992;74:959–974. - PubMed
    1. Pedersen PL. Tumor mitochondria and the bioenergetics of cancer cells. Prog Exp Tumor Res. 1978;22:190–274. - PubMed
    1. Walenta S, Schroeder T, Mueller-Klieser W. Lactate in solid malignant tumors: potential basis of a metabolic classification in clinical oncology. Curr Med Chem. 2004;11:2195–2204. - PubMed
    1. Walenta S, Mueller-Klieser WF. Lactate: mirror and motor of tumor malignancy. Semin Radiat Oncol. 2004;14:267–274. - PubMed

Publication types

MeSH terms