. 2011 Jul;7(7):e1002110.
doi: 10.1371/journal.ppat.1002110. Epub 2011 Jul 7.

CD39/adenosine pathway is involved in AIDS progression

Affiliations

CD39/adenosine pathway is involved in AIDS progression

Maria Nikolova et al. PLoS Pathog. 2011 Jul.

Abstract

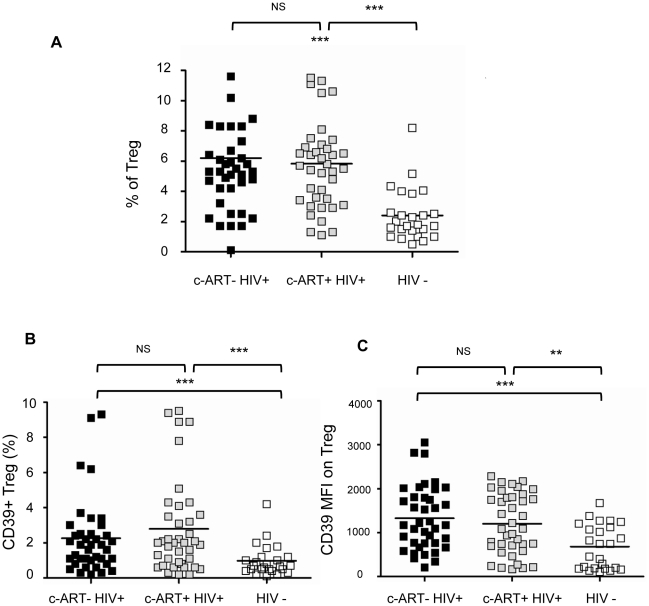
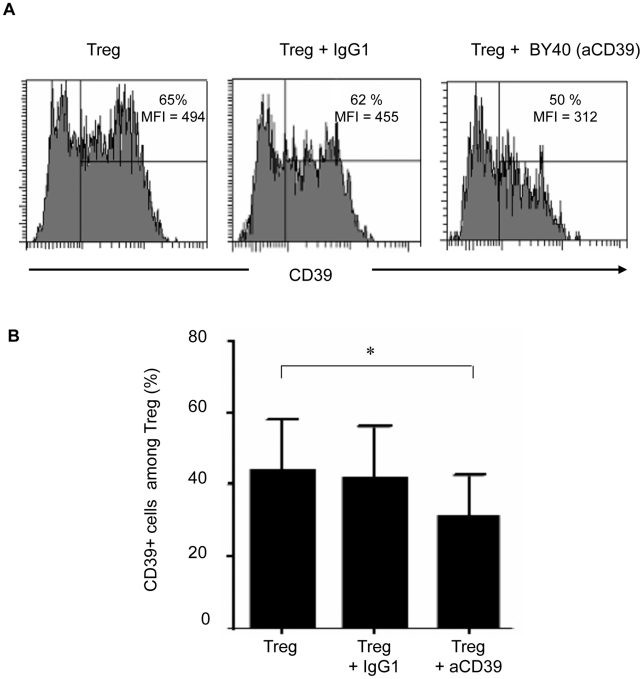
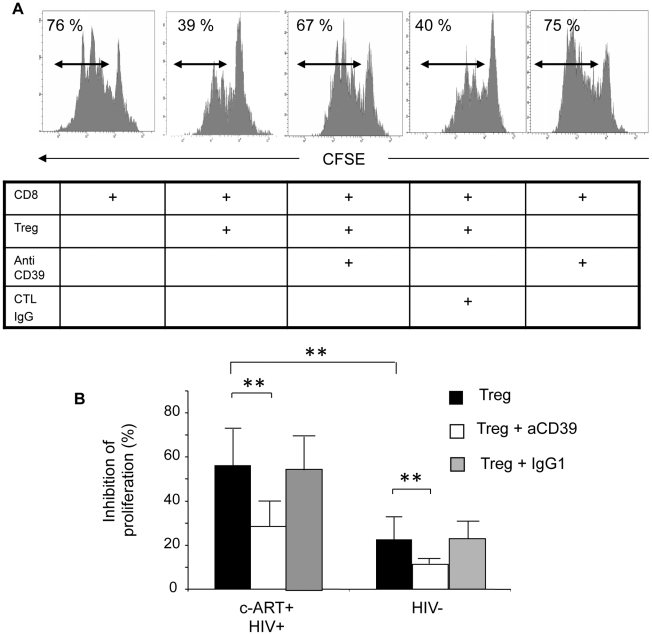
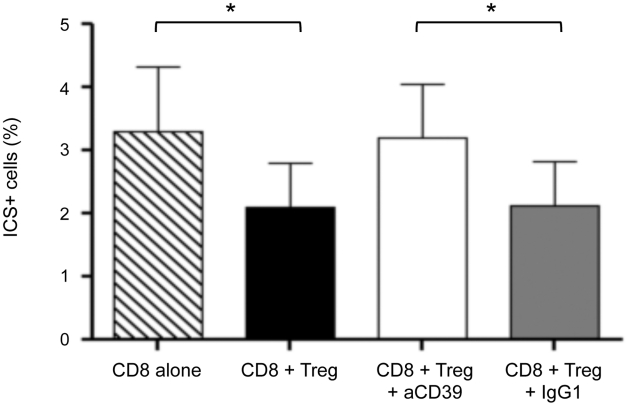
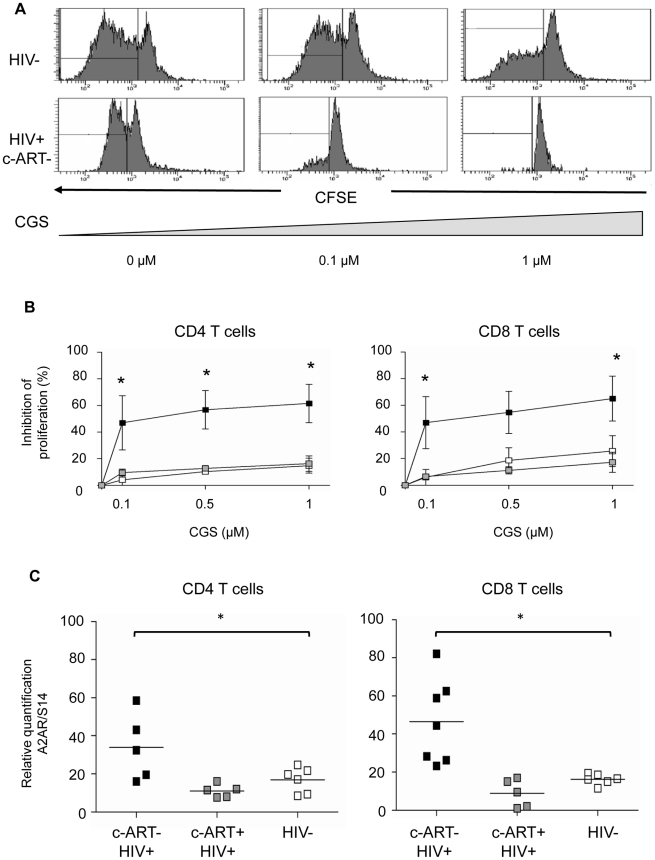
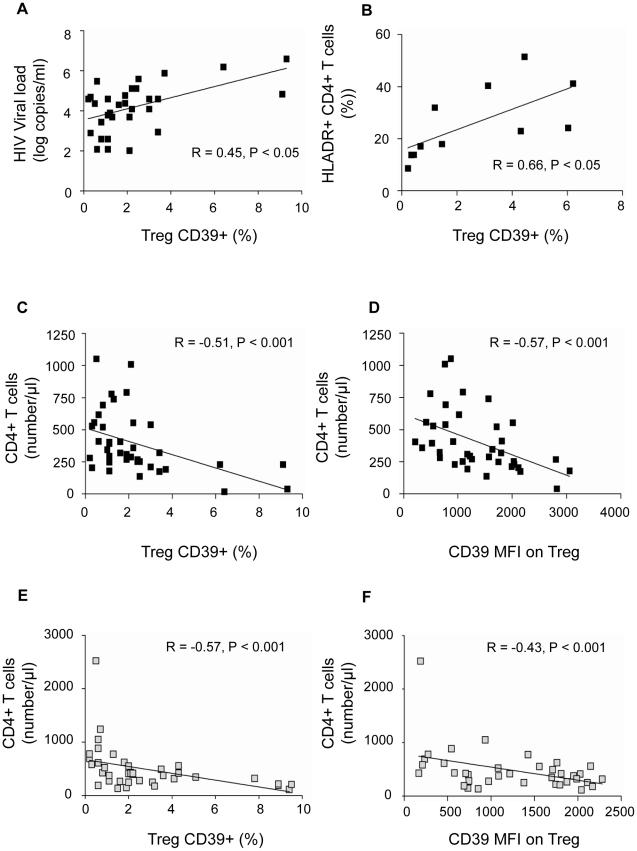
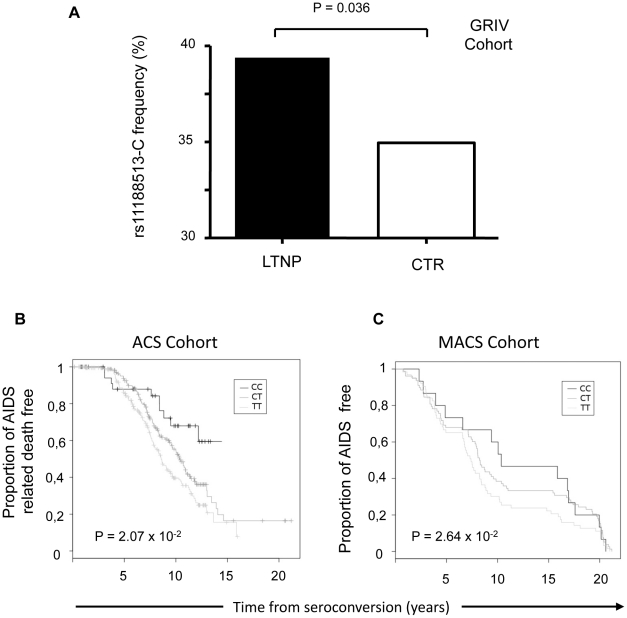
HIV-1 infection is characterized by a chronic activation of the immune system and suppressed function of T lymphocytes. Regulatory CD4+ CD25(high) FoxP3+CD127(low) T cells (Treg) play a key role in both conditions. Here, we show that HIV-1 positive patients have a significant increase of Treg-associated expression of CD39/ENTPD1, an ectoenzyme which in concert with CD73 generates adenosine. We show in vitro that the CD39/adenosine axis is involved in Treg suppression in HIV infection. Treg inhibitory effects are relieved by CD39 down modulation and are reproduced by an adenosine-agonist in accordance with a higher expression of the adenosine A2A receptor on patients' T cells. Notably, the expansion of the Treg CD39+ correlates with the level of immune activation and lower CD4+ counts in HIV-1 infected patients. Finally, in a genetic association study performed in three different cohorts, we identified a CD39 gene polymorphism that was associated with down-modulated CD39 expression and a slower progression to AIDS.


Conflict of interest statement

The authors have declared that no competing interests exist.

Figures

Figure 1
Figure 1. Treg CD39 populations are significantly increased in HIV-1 infected subjects.
PBMC from c-ART− HIV-1-positive subjects (black squares, n = 39), c-ART+ HIV-1-positive subjects (grey squares, n = 39) and HIV-negative subjects (white squares, n = 25) were analysed by flow cytometry. The mean (min-max) CD4 T absolute counts were 411 (18–1053) and 650 (117–2523) cells/ml, in c-ART− and c-ART+ patients, respectively. The mean (min-max) plasma HIV RNA values were 4.6 (2.1–6.2) and 1.57 (1.1–2.03) log10 HIV-1 RNA copies/ml, in the two groups, respectively. The percentage of CD4+CD25highFoxp3+CD127low cells (Treg) on CD4 T cells (A), of Treg CD39+ (B) and the MFI of CD39 expression on Treg (C) are presented. Horizontal lines correspond to the mean for each data set Statistical differences were assessed by unpaired t-test assuming independent samples, ** P<0.01, ***P<0.001.
Figure 2
Figure 2. Preincubation of Treg with anti-CD39 BY40 mAb down-modulates CD39 expression on Treg.
(A) Representative experiment showing the expression of CD39 on Treg from an HIV-negative donor, preincubated in medium alone (left histogram) or either with IgG1 isotype control (middle histogram) or anti-CD39 mAb BY40 (right histogram), and co-cultured for 18 h with anti-CD3-activated autologous CD8 T cells. Expression of CD39 was then assessed using a BY40 non-competitive anti-CD39 mAb on gated CD4+CD25highCD127lowFoxp3+ cells. (B) Pooled data from 3 independent experiments show the percentage of CD39+ cells among Treg after co-culture as in (A). Bars represent mean +/− SD. Statistical differences were assessed by a paired Student t-test, * P<0.05.
Figure 3
Figure 3. CD39 blocking mAb reverses the suppressive effect of Treg on the proliferation of anti-CD3 stimulated CD8+ T cells.
(A) Representative histograms showing the anti-CD3 stimulated proliferation of purified CD8+ T alone or co-cultured with Treg without pre-incubation or pre-incubated with anti-CD39 mAb or control IgG1 (Histograms are gated on the CD8high populations). Percentage of proliferating (CFSElow) CD8+ T cells is shown for each condition (one representative experiment from 3 performed in triplicate). (B) Pooled data showing the percentage of proliferation inhibition of anti-CD3 stimulated CD8+ T cells from c-ART+ HIV-1-positive (n = 6) and HIV-negative subjects (n = 6) in the presence of Treg either alone (black squares), pre-incubated with anti-CD39 mAb (white squares) or with control IgG1 (gray squares). Histograms represent means +/− SD. Statistical differences were assessed by one-way ANOVA followed by a paired T- test, * P<0.05, ** P<0.01.
Figure 4
Figure 4. CD39 blocking mAb reverses the suppressive effect of Treg on the cytokine production of Gag-stimulated CD8+ T cells.
Pooled data showing the percentage of CD8+ T cells from c-ART− HIV-1-positive patients (n = 5) producing cytokines (IL2/IFN-g/TNF-a) after overnight stimulation with Gag peptides. CD8+ T cells were cultured in the presence or not of Treg (ratio ¼) and in the presence or not of antiCD39 Mab or isotype control (see M&M). Histograms represent means +/− SD. Statistical differences were assessed by a paired t-test, * P<0.05.
Figure 5
Figure 5. T cells from c-ART− HIV-1 positive patients are more susceptible to the inhibitory effects of the adenosine agonist CGS-21680 and express a high density of A2A receptor.
(A) PBMC from one representative control (upper panel) and one c-ART− HIV-1-positive subject (lower panel) were labelled with CFSE and activated using anti-CD3 mAb. CGS-21680 was added at day 0 and histograms of CFSE staining of gated CD8+ T cells are from day 5. (B) Pooled data (n = 4) from c-ART− (black squares) and c-ART+ (grey squares) HIV-positive, and from HIV-negative (white squares) subjects showing the dose-dependent effect of CGS-21680 on the proliferation of anti-CD3 activated CD4+ (left panel) and CD8+ (right panel) T cells treated as in (A). (C) CD4+ and CD8+ T cells were purified from the blood of c-ART− subjects (black squares, n = 5), c-ART+ subjects (grey squares, n = 7), and HIV-negative subjects (white squares, n = 6). A2AR mRNA expression was assessed using qPCR. Results were standardized using the expression of the S14 mRNA house-keeping gene. Horizontal lines correspond to the mean for each data set, statistical differences were assessed by one-way ANOVA and unpaired t-test assuming independent samples, * P<0.05., * P<0.05.
Figure 6
Figure 6. CD39 expression on Treg correlates positively with viral load and T cell activation and negatively with CD4+ T cell count in HIV-1 positive subjects.
Data from c-ART− (A, n = 31, B, n = 11, C, n = 39, D, n = 38 and, black squares) and c-ART+ HIV-1 subjects (E, n = 39, F, n = 37, gray squares) are shown. In c-ART−HIV-1 positive subjects, the percentage of Treg CD39+ correlates directly with HIV-1 viral load (A) and the expression of the activation marker HLA-DR on CD4+ T cells (B). The percentage of Treg CD39+ (C, E) and the MFI of CD39 expression on Treg (D, F) correlates inversely with the absolute CD4+ T cell count in both c-ART+ and c-ART− groups. Correlations were assessed using Spearman's rank order test.
Figure 7
Figure 7. Effect of rs11188513 in the GRIV, ACS and MACS study groups.
(A) Allelic frequency of rs11188513-C in the GRIV LTNP population (LTNP, n = 275) and the control group (CTR, n = 697). (B) Kaplan-Meier survival curve derived from the ACS cohort (n = 404) for time to AIDS-related death. Genotypes CC (black), CT (dark grey) and TT (light grey). (C) Kaplan-Meier survival curve derived from the MACS cohort (n = 156) for time to clinical AIDS. Genotypes CC (black), CT (dark grey) and TT (light grey). P-values were computed by regression in an additive model including as covariates the 10 principal Eigenstrat components. The GRIV cohort comprised 275 LTNP and 86 RP French HIV-1 seropositive individuals of Caucasian descent. The control group comprised 697 French HIV-1 seronegative individuals of Caucasian descent from the D.E.S.I.R. program. In the ACS cohort, 417 HIV-1 subjects were collected on the course of HIV-1 infection using AIDS-related death as an endpoint. In the MACS cohort, 156 HIV-1 Caucasian homosexual men were included, using time to clinical AIDS as an endpoint.

References

    1. Appay V, Nixon DF, Donahoe SM, Gillespie GM, Dong T, et al. HIV-specific CD8(+) T cells produce antiviral cytokines but are impaired in cytolytic function. J Exp Med. 2000;192:63–75. - PMC - PubMed
    1. Aandahl EM, Michaelsson J, Moretto WJ, Hecht FM, Nixon DF. Human CD4+CD25+ regulatory T cells control T-cell responses to human immunodeficiency virus and cytomegalovirus antigens. J Virol. 2004;78:2454–2459. - PMC - PubMed
    1. Cabrera R, Tu Z, Xu Y, Firpi RJ, Rosen HR, et al. An immunomodulatory role for CD4(+)CD25(+) regulatory T lymphocytes in hepatitis C virus infection. Hepatology. 2004;40:1062–1071. - PubMed
    1. Kinter AL, Hennessey M, Bell A, Kern S, Lin Y, et al. CD25(+)CD4(+) regulatory T cells from the peripheral blood of asymptomatic HIV-infected individuals regulate CD4(+) and CD8(+) HIV-specific T cell immune responses in vitro and are associated with favorable clinical markers of disease status. J Exp Med. 2004;200:331–343. - PMC - PubMed
    1. Kared H, Lelievre JD, Donkova-Petrini V, Aouba A, Melica G, et al. HIV-specific regulatory T cells are associated with higher CD4 cell counts in primary infection. AIDS. 2008;22:2451–2460. - PMC - PubMed

MeSH terms