. 2011 Jul;7(7):e1002117.
doi: 10.1371/journal.ppat.1002117. Epub 2011 Jul 7.

Unique cell adhesion and invasion properties of Yersinia enterocolitica O:3, the most frequent cause of human Yersiniosis

Affiliations

Unique cell adhesion and invasion properties of Yersinia enterocolitica O:3, the most frequent cause of human Yersiniosis

Frank Uliczka et al. PLoS Pathog. 2011 Jul.

Abstract

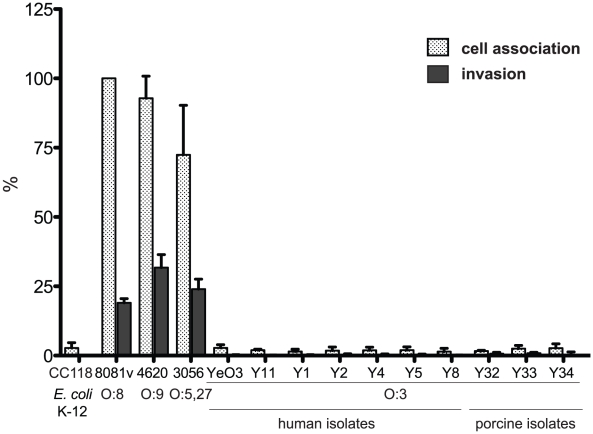
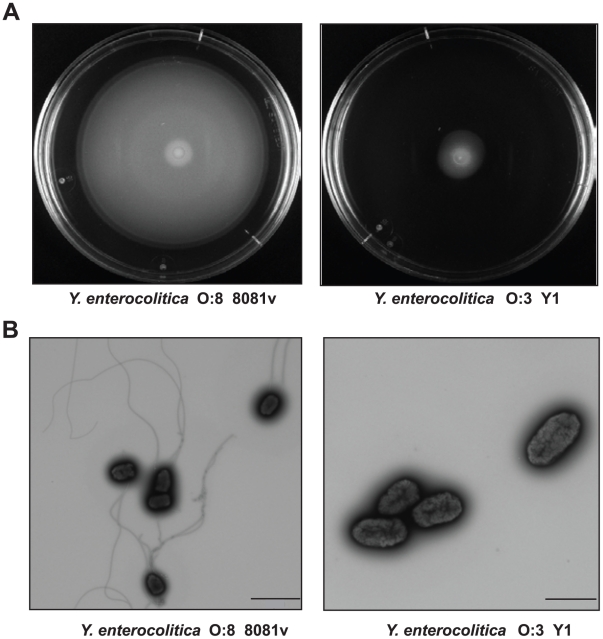
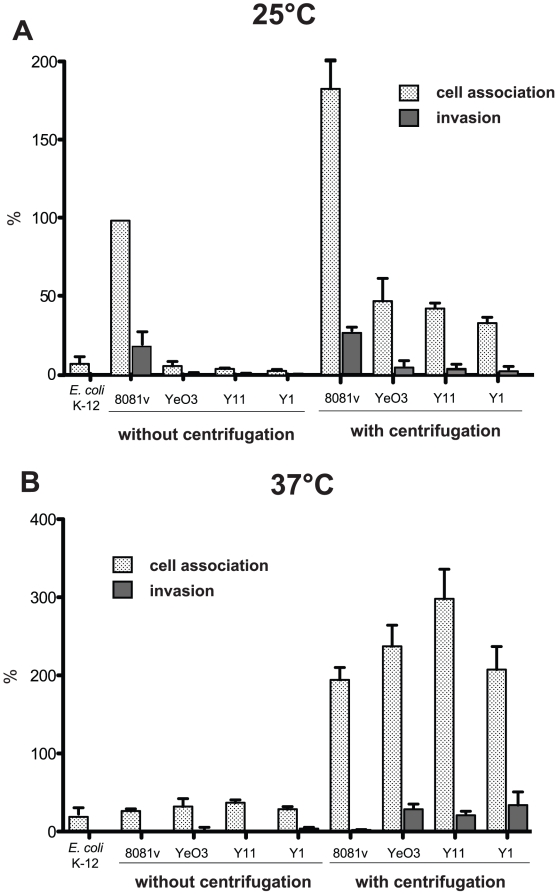
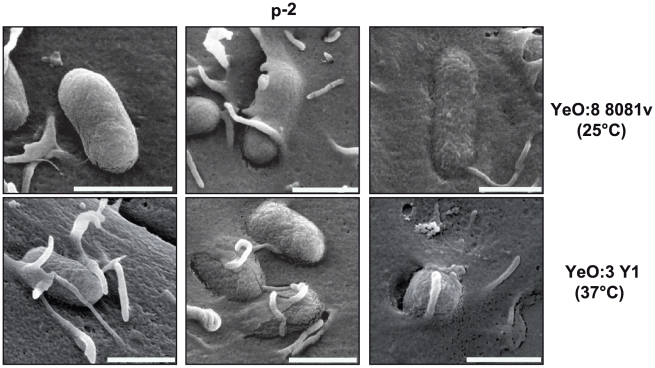
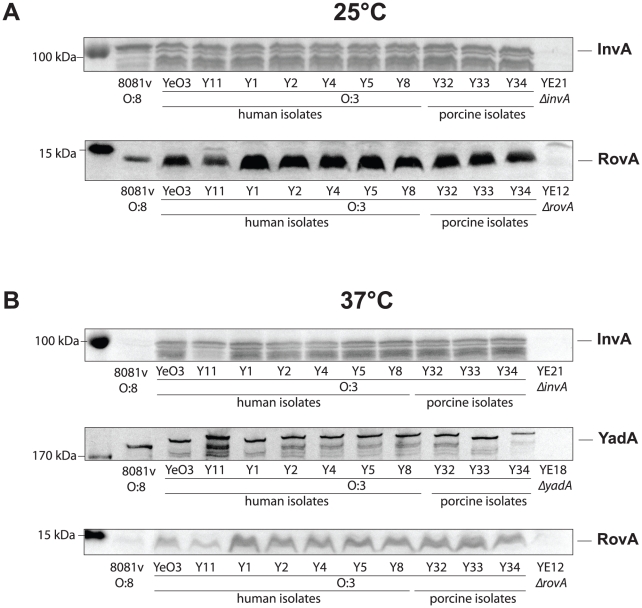
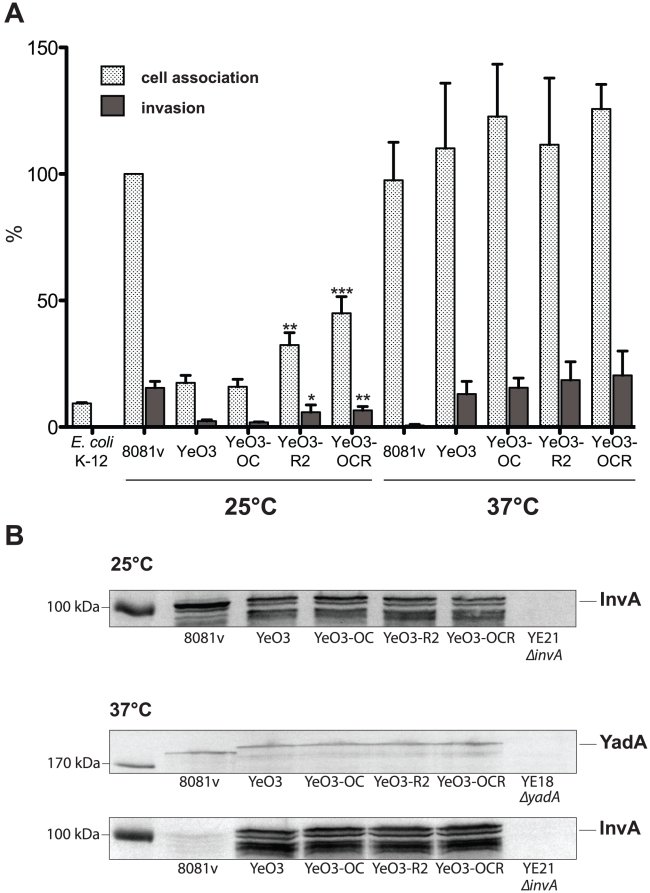
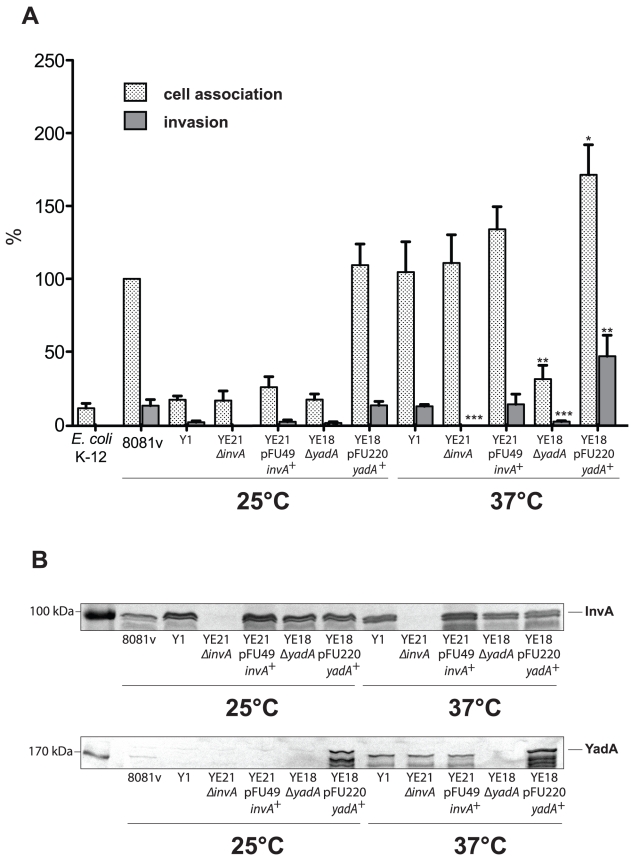
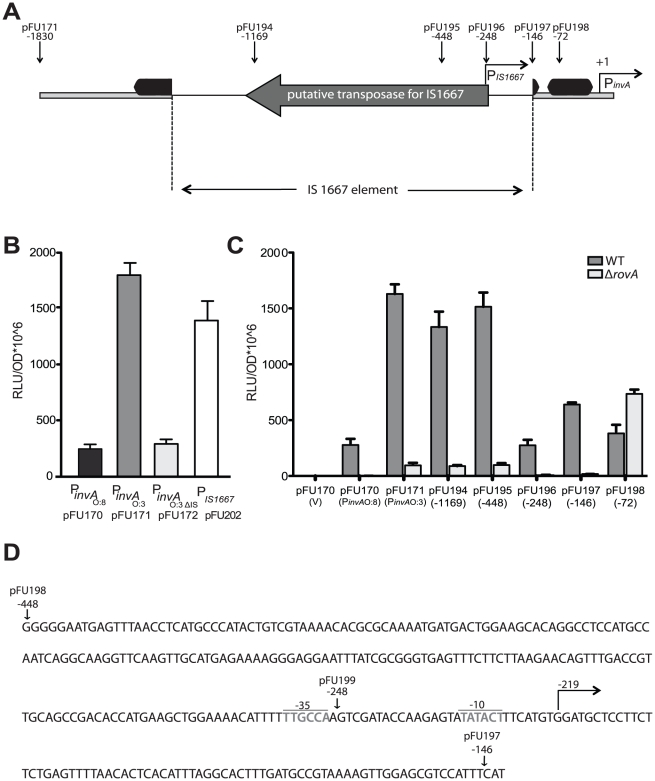
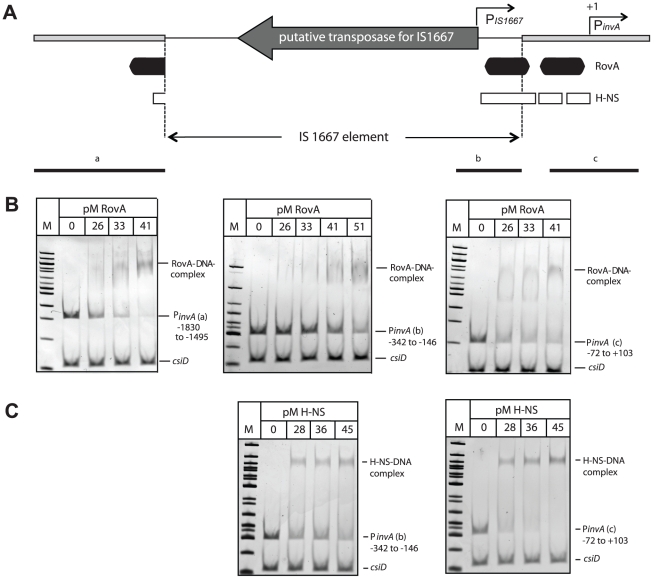
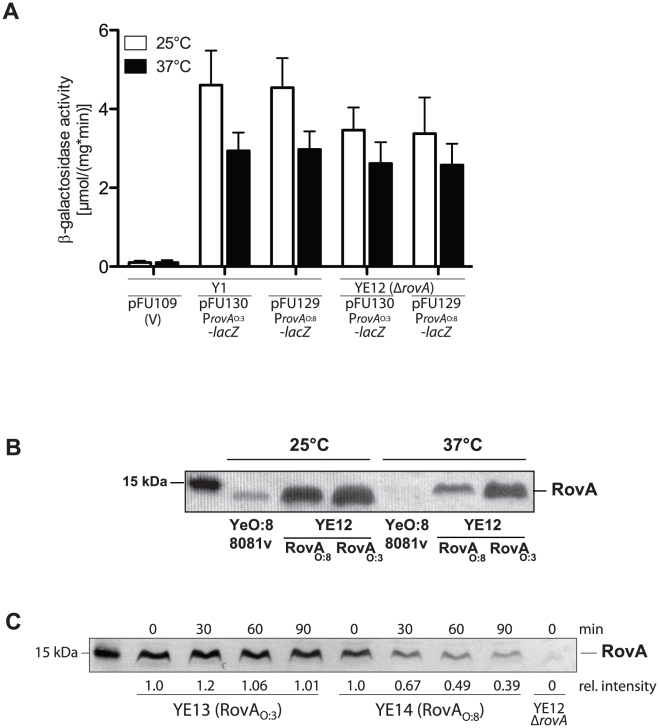
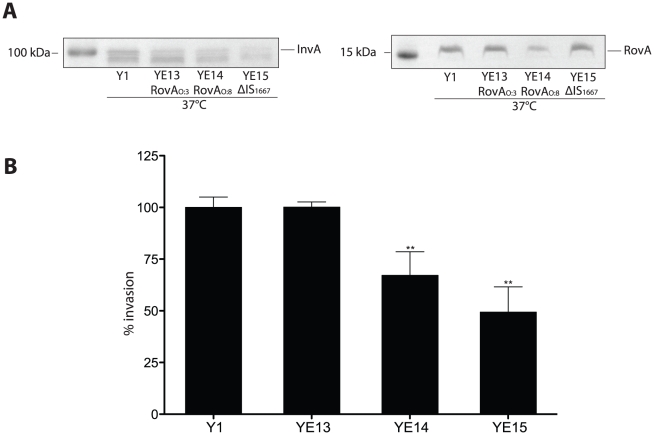
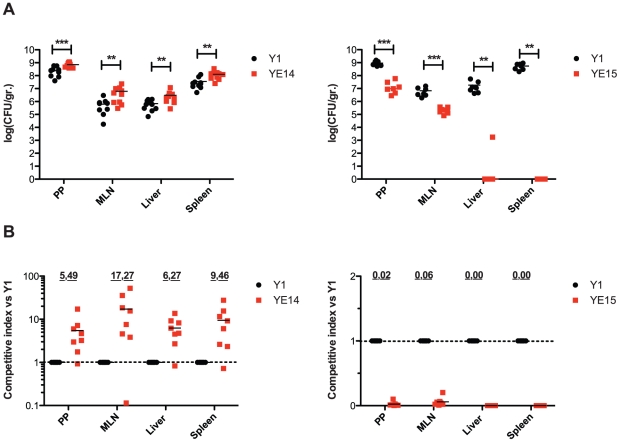
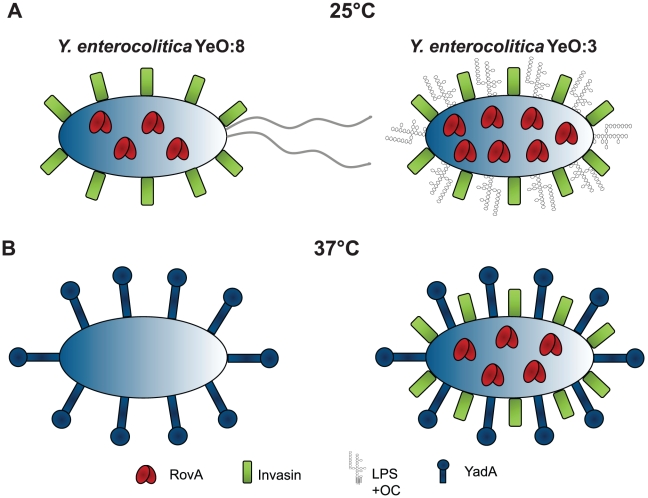
Many enteric pathogens are equipped with multiple cell adhesion factors which are important for host tissue colonization and virulence. Y. enterocolitica, a common food-borne pathogen with invasive properties, uses the surface proteins invasin and YadA for host cell binding and entry. In this study, we demonstrate unique cell adhesion and invasion properties of Y. enterocolitica serotype O:3 strains, the most frequent cause of human yersiniosis, and show that these differences are mainly attributable to variations affecting the function and expression of invasin in response to temperature. In contrast to other enteric Yersinia strains, invasin production in O:3 strains is constitutive and largely enhanced compared to other Y. enterocolitica serotypes, in which invA expression is temperature-regulated and significantly reduced at 37°C. Increase of invasin levels is caused by (i) an IS1667 insertion into the invA promoter region, which includes an additional promoter and RovA and H-NS binding sites, and (ii) a P98S substitution in the invA activator protein RovA rendering the regulator less susceptible to proteolysis. Both variations were shown to influence bacterial colonization in a murine infection model. Furthermore, we found that co-expression of YadA and down-regulation of the O-antigen at 37°C is required to allow efficient internalization by the InvA protein. We conclude that even small variations in the expression of virulence factors can provoke a major difference in the virulence properties of closely related pathogens which may confer better survival or a higher pathogenic potential in a certain host or host environment.


Conflict of interest statement

The authors have declared that no competing interests exist.

Figures

Figure 1
Figure 1. Y. enterocolitica O:3 interaction with epithelial cells.
Ten different Y. enterocolitica serotype O:3 isolates from human patients or pigs, Y. enterocolitica O:8 strain 8081v, Y. enterocolitica O:9 strain 4620 and Y. enterocolitica O:5,27 strain 3056 were grown at 25°C overnight in LB medium. About 5·104 HEp-2 cells were infected with 5·105 bacteria and incubated at 22–25°C to monitor cell association or 37°C to determine the internalization efficiency of the bacteria by the gentamicin protection assay. E. coli K-12 was used as negative control. Data are presented as means ± standard deviations of three independent experiments performed in duplicate.
Figure 2
Figure 2. Motility and flagellation of Y. enterocolitica O:3 and O:8.
(A) Swimming of Y. enterocolitica O:3 (Y1) and O:8 (8081v). Aliquots of 2 µl of the bacterial culture were inoculated onto LB swimming plates. The plates were incubated at 25°C for 48 h. (B) Transmission electron microscopy of Y. enterocolitica O:3 (Y1) and O:8 (8081v) grown to stationary phase. Bars indicate 2 µm and 1 µm, respectively.
Figure 3
Figure 3. Host cell interaction of Y. enterocolitica O:3 by InvA at 25°C is less efficient due to amotility.
Amotile Y. enterocolitica O:3 strains YeO3, Y11, and Y1 and motile Y. enterocolitica strain O:8 8081v were grown at 25°C (A) or 37°C (B) overnight. About 5·104 HEp-2 cells were infected with 5·105 bacteria and incubated with or without centrifugation of the bacteria onto the monolayer to monitor cell association (adhesion+invasion) or the internalization efficiency of the bacteria by the gentamicin protection assay. E. coli K-12 was used as negative control. Data are presented as means ± standard deviations of three independent experiments performed in duplicate.
Figure 4
Figure 4. Y. enterocolitica O:3 and O:8 interaction with epithelial cells.
Y. enterocolitica O:3 strain Y1 was pregrown at 37°C and Y. enterocolitica O:8 strain 8081v was grown at 25°C. The bacteria were added to HEp-2 and incubated for 30 min at 37°C after centrifugation of the bacteria onto the monolayer. Different stages of the internalization process are shown (initial binding, filopodia and lamellipodia formation). Bars indicate 1 µm.
Figure 5
Figure 5. Expression analysis of Y. enterocolitica O:3 invasin, YadA, and RovA.
Y. enterocolitica O:3 strains and the serotype O:8 reference strain 8081v were grown overnight at 25°C (A) and 37°C (B). Whole cell extracts for analysis of the DNA-binding protein RovA and the adhesins InvA and YadA were prepared, separated on SDS-polyacrylamid gels and analyzed by western blotting using polyclonal antibodies directed against RovA, InvA and YadA. A molecular marker the PageRuler Prestained Protein Ladder was loaded on the left.
Figure 6
Figure 6. Influence of the Y. enterocolitica O:3 O-antigen on host cell invasion.
Y. enterocolitica wildtype strains YeO3 and 8081v, and outer core and/or O-antigen deficient derivatives (YeO3-OC, YeO3-R2, YeO3-OCR) were grown at 25°C and 37°C. (A) About 5×10⁴ HEp-2 cells were infected with 5×10⁵ bacteria. After centrifugation of the bacteria onto the monolayer, cell association (adhesion+invasion) was monitored and internalization efficiency of the bacteria was determined by the gentamicin protection assay. E. coli K-12 was used as negative control. Data are presented as means ± standard deviations of three independent experiments performed in duplicate. Data were analyzed by the students t test. Stars indicate the results that differed significantly from those of YeO3 with * (P<0.05), ** (P<0.01), and *** (P<0.001) (B) Whole cell extracts were prepared from overnight cultures, separated on SDS-polyacrylamide gels and analyzed by western blotting using polyclonal antibodies directed against InvA and YadA. As a molecular marker the PageRuler Prestained Protein Ladder was loaded on the left.
Figure 7
Figure 7. Coexpression of invasin and YadA is necessary for efficient invasion at 37°C.
Y. enterocolitica strain O:8 strain 8081v, Y. enterocolitica O:3 strain Y1 and isogenic invA and yadA deficient mutant derivatives were grown overnight at 25°C and 37°C. (A) About 5·104 HEp-2 cells were infected with 5·105 bacteria and after centrifugation of the bacteria onto the monolayer the samples cell association (adhesion+invasion) was monitored and internalization efficiency of the bacteria was determined by the gentamicin protection assay. Data are presented as means ± standard deviations of three independent experiments performed in duplicate. Data were analyzed by the students t test. Data were analyzed by the students t test. Stars indicate the results that differed significantly from those of Y1 with * (P<0.05), ** (P<0.01), and *** (P<0.001). (B) Whole cell extracts were prepared from the overnight cultures, separated on SDS-polyacrylamide gels and analyzed by western blotting using polyclonal antibodies directed against InvA and YadA. As a molecular marker the PageRuler Prestained Protein Ladder was loaded on the left.
Figure 8
Figure 8. Analysis of invA expression in Y. enterocolitica O:3.
(A) An overview of the invA promoter region including the IS1667 insertion of Y. enterocolitica O:3 strains is shown. The transcriptional start sites of the invA gene and from the predicted IS1667-encoded promoter are indicated by broken arrows, the dark boxes indicate the RovA binding sites identified in the homologous invA promoter of Y. pseudotuberculosis. The thick line represents the invA promoter sequence and the thin line illustrates the IS1667 sequence. The arrow indicates the gene encoding the putative transposase of the IS1667 element. Sites used for the upstream deletion constructs are indicated by arrows. The numbers indicate the position of the deletion relative to the transcriptional start site of the invA gene. (B) Overnight cultures of Y. enterocolitica O:3 strain Y1 harbouring the PinvA O:8::luxCDABE (pFU170), PinvA O:3::luxCDABE (pFU171), PinvA O:3ΔIS::luxCDABE (pFU172) and PIS1667::luxCDABE (pFU202) fusion constructs were diluted (1∶100) and grown in LB at 37°C for four hours and luciferase activity was determined. (C) Expression by progressive deletion of the invA 5′-regulatory region was analyzed in Y. enterocolitica O:3 Y1 and the isogenic rovA mutant derivative Y12 harbouring the PinvAO:3::luxCDABE fusion. The numbers indicate the 5′ end points of the regulatory region of invA from Y. enterocolitica O:3 in the fusion constructs relative to the transcriptional start site (+1). The luciferase activity determined from the cultures is given in relative light units (RLU) and represents the mean ± standard deviation of at least three independent experiments. (D) Sequence of the 3′-end of the IS1667 inserted into invA of Y. enterocolitica O:3 at position −143 is shown. The −10 and −35 region of the predicted IS1667-encoded promoter are indicated. Sites used for the upstream deletion constructs are indicated by arrows. The numbers indicate the position of the deletion relative to the transcriptional start site of the invA gene.
Figure 9
Figure 9. RovA and H-NS binding to the Y. enterocolitica O:3 invA regulatory region.
(A) Overview of the invA promoter region of Y. enterocolitica O:3 strains. The transcriptional start sites of the invA promoter and of the predicted IS1667-encoded promoter are indicated by broken arrows. The dark boxes represent the RovA and the white small boxes the H-NS binding sites identified in the homologous invA promoter of Y. pseudotuberculosis. The thick line represents the invA promoter sequence and the thin line illustrates the sequence of the IS1667 element with the putative transposase gene. Fragments used for the band shift experiments are shown as black lines. Competitive gel retardation assays using purified RovA protein (B) or purified H-NS (C) of Y. enterocolitica O:3 strain Y1. DNA fragments comprising different portions of the invA regulatory region of Y1 were incubated without or with increasing concentrations of purified RovA or H-NS. The DNA-protein complexes were separated on a 4% polyacrylamide gene, a molecular weight standard 100 bp ladder was loaded on the left. The higher molecular weight protein-DNA complexes are marked by an arrow and the positions of the non-shifted and control fragments are indicated.
Figure 10
Figure 10. Analysis of RovA production and stability in Y. enterocolitica O:3.
(A) Y. enterocolitica strains Y1 and the isogenic rovA mutant of Y1 (YE12) harboring plasmids encoding the promoterless lacZ gene or the ProvA O:8-lacZ or ProvA O:3-lacZ fusions were grown at 25°C and 37°C overnight. The beta-galactosidase activity determined from the cultures is given in µmol min−1 mg−1 and represents the mean ± standard deviation of at least three independent experiments. (B) A Y. enterocolitica O:3 ΔrovA mutant strain (YE12) harboring the rovA encoding plasmids pFU119 (rovA O:3) or pFU138 (rovA O:8) and YeO:8 strain 8081v were grown overnight at 25°C and 37°C. Whole cell extracts were prepared from the cultures, separated on SDS-polyacrylamide gels and analyzed by western blotting using polyclonal antibodies directed against RovA. As a molecular marker the PageRuler Prestained Protein Ladder was loaded on the left. (C) Isogenic Y. enterocolitica strains YE13 and YE14 expressing the RovA wildtype protein or the RovAS98P derivative were grown to exponential phase (OD600 = 0.6–0.7) at 37°C before gentamicin (50 µg ml−1) and tetracycline (50 µg ml−1) were added. The cultures were incubated at 37°C for additional 90 min. Aliquots of the cultures were removed at the indicated times thereafter, whole cell extracts for identical numbers of bacteria were prepared and intracellular RovA was visualized by western blotting.
Figure 11
Figure 11. Influence of enhanced invasin and RovA levels on Y. enterocolitica O:3 host cell invasion.
(A) Whole cell extracts were prepared from the cultures, separated on SDS-polyacrylamide gels and analyzed by western blotting using polyclonal antibodies directed against InvA and RovA. As a molecular marker the PageRuler Prestained Protein Ladder was loaded on the left. (B) YeO:3 strains Y1 (wt), YE13 (rovAO:3S98), YE14 (rovAO:8P98) and YE15 (rovAO:3ΔIS1667) were grown at 37°C. Approximately 106 bacteria were centrifugated onto 104 HEp-2 cells. Total numbers of intracellular bacteria were determined and are expressed relative to the invasion rate of YeO:3 strain Y1 defined as 100%. Each value represents the mean of at least three different assays done in triplicate. Data were analyzed by the students t test, **, significantly different from Y1 or YE13 with P<0.001.
Figure 12
Figure 12. Influence of enhanced invasin and RovA levels on Y. enterocolitica O:3 virulence.
(A) BALB/c mice were co-infected via the orogastric route with 5×10⁸ bacteria in an inoculum comprised of an equal mixture of YeO:3 strains Y1 (wt, rovA O:3) and YE14 (rovA O:8), or Y1 (wt, rovA O:3) and YE15 (rovAO:3PinvΔIS). Three days post infection, the mice were sacrificed and the numbers of surviving bacteria in the liver, spleen, mesenterial lymph nodes (MLN), and Peyer's patches (PP) were determined as described in Material and Methods. Data are presented as a scatter plot of numbers of cfu per gram of organ as determined by counts of viable bacteria on plates. Each spot represents the cfu count, in the indicated tissue samples from one mouse. The levels of statistical significance for differences between test groups were determined by the Mann-Whitney-test. Stars indicate results that differed significantly from those of Y1 with ** (P<0.01), and *** (P<0.001). (B) Data are graphed as competitive index values for the tissue samples from one mouse. The bars represent the means of the competitive index values. A competitive index score of 1 denotes no difference in the virulence compared to Y1. Underlined scores denote where statistically significant differences were observed. The two strains Y1 and Y15 used for competition assays were differentially marked with antibiotics resistances on plasmids.
Figure 13
Figure 13. Comparison of Y. enterocolitica O:3 and O:8 mediated temperature regulated control of host cell invasion.
Model of virulence factor expression of Y. enterocolitica O:3 and O:8 in response to temperature. (A) At moderate temperature, rovA expression is induced in Y. enterocolitica O:8 which leads to activation of invasin expression. Furthermore, flagella production is activated and enhances host cell contact, and LPS molecules are synthesized which do not interfere with invasin function. This leads to an efficient internalization of the serotype O:8 strains after growth at environmental temperatures. At 37°C, RovA is rapidly degraded resulting in downregulation of invasin. In addition, flagella and O-antigen production is repressed, whereas synthesis of the adhesin YadA is induced which allows efficient adhesion, but no internalization into epithelial cells. (B) Y. enterocolitica O:3 produce similar and significantly higher amounts of invasin at environmental and body temperature due to an IS insertion into the invA upstream region and a stable RovA activator protein both abolishing H-NS mediated repression. However, internalization into host cells is strongly reduced at 25°C due to steric hindrance by the unique O-antigen and repression of YadA which strongly enhances and stabilizes host cell interactions at 37°C. LPS+OC: lipopolysaccharides with O-antigen and outer core.

References

    1. Bottone EJ. Yersinia enterocolitica: the charisma continues. Clin Microbiol Rev. 1997;10:257–276. - PMC - PubMed
    1. Hanski C, Naumann M, Hahn H, Riecken EO. Determinants of invasion and survival of Yersinia enterocolitica in intestinal tissue. An in vivo study. Med Microbiol Immunol. 1989;178:289–296. - PubMed
    1. Grutzkau A, Hanski C, Hahn H, Riecken EO. Involvement of M cells in the bacterial invasion of Peyer's patches: a common mechanism shared by Yersinia enterocolitica and other enteroinvasive bacteria. Gut. 1990;31:1011–1015. - PMC - PubMed
    1. Pepe JC, Miller VL. Yersinia enterocolitica invasin: a primary role in the initiation of infection. Proc Natl Acad Sci U S A. 1993;90:6473–6477. - PMC - PubMed
    1. Carter PB. Pathogenecity of Yersinia enterocolitica for mice. Infect Immun. 1975;11:164–170. - PMC - PubMed

MeSH terms