. 2011 Jul;7(7):e1002162.
doi: 10.1371/journal.pgen.1002162. Epub 2011 Jul 7.

Interactions between glucocorticoid treatment and cis-regulatory polymorphisms contribute to cellular response phenotypes

Affiliations

Interactions between glucocorticoid treatment and cis-regulatory polymorphisms contribute to cellular response phenotypes

Joseph C Maranville et al. PLoS Genet. 2011 Jul.

Abstract

Glucocorticoids (GCs) mediate physiological responses to environmental stress and are commonly used as pharmaceuticals. GCs act primarily through the GC receptor (GR, a transcription factor). Despite their clear biomedical importance, little is known about the genetic architecture of variation in GC response. Here we provide an initial assessment of variability in the cellular response to GC treatment by profiling gene expression and protein secretion in 114 EBV-transformed B lymphocytes of African and European ancestry. We found that genetic variation affects the response of nearby genes and exhibits distinctive patterns of genotype-treatment interactions, with genotypic effects evident in either only GC-treated or only control-treated conditions. Using a novel statistical framework, we identified interactions that influence the expression of 26 genes known to play central roles in GC-related pathways (e.g. NQO1, AIRE, and SGK1) and that influence the secretion of IL6.


Conflict of interest statement

The authors have declared that no competing interests exist.

Figures

Figure 1
Figure 1. Quantile-quantile plots summarizing the results from tests for genetic variation associated with log fold change in expression.
a) Test of all HapMap SNPs within 100 kb of the gene that encodes GR. b) Test of all HapMap SNPs within transcription factors that interact with the GR. c) Results from genome-wide scan (all HapMap SNPs) are compared to scan limited to SNPs within 500 kb and 100 kb of each gene. Observed p-values are shown as black dots. P-values from permutations are shown as grey dots. Results from 100 permutations are shown for a) and b), and results from 3 permutations are shown for c).
Figure 2
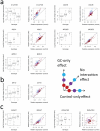
Figure 2. Patterns of interaction between genotype and GC treatment that underlie associations with log fold change for each of the 8 genes where log fold change is significantly associated with genotype at a SNP within 100 kb.
Plots on the left show the effect of genotype on log2 fold change, with genotype coded as copies of the minor allele. In plots on the right, each small dot corresponds to an individual and is color coded based on genotype (red = homozygous for major allele, purple = heterozygous, and blue = homozygous for minor allele). Large dots represent genotypic means. Associations are classified based on the configuration of genotypic effects in the two conditions, including a) genotypic effects only in GC-treated samples, b) genotypic effects only in control-treated samples and c) genotypic effects in both conditions that differ. On the right is a cartoon showing patterns of interaction in two-dimensional space with expression after GC-treatment on the y-axis and expression after control-treatment on the x-axis. Each of the three dots on each line corresponds to the mean value for a genotype class (red = homozygous for major allele, purple = heterozygous, and blue = homozygous for minor allele). Genotype is coded as copies of the minor allele. Relative expression corresponds to log2-transformed microarray intensities.
Figure 3
Figure 3. Population differences in transcriptional responses and allele frequency differences at an interaction eQTLs.
a) Observed population differences in log-fold change (y-axis) are plotted against predictions based on genotypic effects and differences in allele frequency (x-axis). Genetic predicted values are significantly correlated with observed differences in response (r2 = 0.33, p = 5.3×10⁻³). b) The global distribution of the C allele at rs689459, which is associated with up-regulation of NQO1 expression by GCs. c) The effect of the population-specific GC-only eQTL at NQO1 by population. In plots on the far right, each small dot corresponds to an individual and is color-coded based on genotype (red = homozygous for G allele, purple = heterozygous, and blue = homozygous for C allele). Large dots represent genotypic means. Genotype is coded as copies of the C allele at rs689459. Relative expression corresponds to log2-transformed microarray intensities.
Figure 4
Figure 4. Secretion QTL for IL6.
Genotype is coded as copies of the minor allele. Log fold change in secretion corresponds to the difference between dex and control of covariate-corrected, quantile-normalized, log2-transformed estimates of relative quantity from ELISA assays. In plot on the right, each small dot corresponds to an individual and is color-coded based on genotype (red = homozygous for major allele, purple = heterozygous, and blue = homozygous for minor allele). Large dots represent genotypic means.

References

    1. Nieman LK, Ilias I. Evaluation and treatment of Cushing's syndrome. Am J Med. 2005;118:1340–1346. - PubMed
    1. Hench PS, Kendall EC, Slocumb CH, Polley HF. Adrenocortical Hormone in Arthritis : Preliminary Report. Ann Rheum Dis. 1949;8:97–104. - PMC - PubMed
    1. Barnes NC. The properties of inhaled corticosteroids: similarities and differences. Prim Care Respir J. 2007;16:149–154. - PMC - PubMed
    1. Hillier SG. Diamonds are forever: the cortisone legacy. J Endocrinol. 2007;195:1–6. - PubMed
    1. Keith BD. Systematic review of the clinical effect of glucocorticoids on nonhematologic malignancy. BMC Cancer. 2008;8:84. - PMC - PubMed

Publication types

MeSH terms