. 2011;6(7):e21929.
doi: 10.1371/journal.pone.0021929. Epub 2011 Jul 5.

Both the C-terminal polylysine region and the farnesylation of K-RasB are important for its specific interaction with calmodulin

Affiliations

Both the C-terminal polylysine region and the farnesylation of K-RasB are important for its specific interaction with calmodulin

Ling-Jia Wu et al. PLoS One. 2011.

Abstract

Background: Ras protein, as one of intracellular signal switches, plays various roles in several cell activities such as differentiation and proliferation. There is considerable evidence showing that calmodulin (CaM) binds to K-RasB and dissociates K-RasB from membrane and that the inactivation of CaM is able to induce K-RasB activation. However, the mechanism for the interaction of CaM with K-RasB is not well understood.

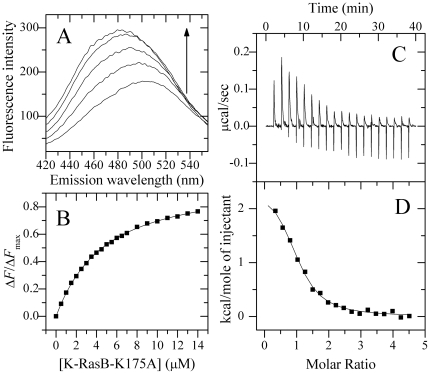
Methodology/principal findings: Here, by applying fluorescence spectroscopy and isothermal titration calorimetry, we have obtained thermodynamic parameters for the interaction between these two proteins and identified the important elements of K-RasB for its interaction with Ca(2+)/CaM. One K-RasB molecule interacts with one CaM molecule in a GTP dependent manner with moderate, micromolar affinity at physiological pH and physiologic ionic strength. Mutation in the polybasic domain of K-Ras decreases the binding affinity. By using a chimera in which the C-terminal polylysine region of K-RasB has been replaced with that of H-Ras and vice versa, we find that at physiological pH, H-Ras-(KKKKKK) and Ca(2+)/CaM formed a 1:1 complex with an equilibrium association constant around 10(5) M(-1), whereas no binding reaction of K-RasB-(DESGPC) with Ca(2+)/CaM is detected. Furthermore, the interaction of K-RasB with Ca(2+)/CaM is found to be enhanced by the farnesylation of K-RasB.

Conclusions/significance: We demonstrate that the polylysine region of K-RasB not only contributes importantly to the interaction of K-RasB with Ca(2+)/CaM, but also defines its isoform specific interaction with Ca(2+)/CaM. The farnesylation of K-RasB is also important for its specific interaction with Ca(2+)/CaM. Information obtained here can enhance our understanding of how CaM interacts with K-RasB in physiological environments.


Conflict of interest statement

Competing Interests: The authors have declared that no competing interests exist.

Figures

Figure 1
Figure 1. Photo-initiated cross-linking of the Ca2+/CaM with K-RasB-GDP and K-RasB-GppNHp.
Samples containing Ca2+/CaM alone (lane 1), Ca2+/CaM and K-RasB-GDP (lane 4), or Ca2+/CaM and K-RasB-GppNHp (lane 5), were irradiated for 1 minute with a 150-W common flashlight as described in “Materials and Methods”. Samples containing Ca2+/CaM and K-RasB-GDP (lane 2), or Ca2+/CaM and K-RasB-GppNHp (lane 3) without Ru(bpy)3Cl2 and irradiation were also conducted as controls. Shown is a Western blot using antibody raised against CaM.
Figure 2
Figure 2. Interaction of K-RasB with Ca2+/CaM at 25.0°C.
Fluorescence spectra (A) of 1.0 µM dansyl-CaM in the absence and in the presence of K-RasB-GppNHp at different concentrations. The arrow represents the concentration of K-RasB-GppNHp increases gradually from 0 (the bottom) to 8.0 µM (the top). ΔFF max for the binding of K-RasB-GppNHp to Ca2+/CaM plotted as a function of the concentration of K-RasB-GppNHp (B). The solid squares were the experimental data and the solid line represented the best fit. The panel C represents typical calorimetric titration of K-RasB-GppNHp (20.0 µM) with CaM (300 µM) in the presence of 1 mM CaCl2. The panel D shows the plots of the heat evolved (kcal) per mole of CaM added, corrected for the heat of CaM, against the molar ratio of CaM to K-RasB. The data (solid squares) were fitted to a single set of identical sites model and the solid line represented the best fit. The corresponding parameters from B and D are summarized in Table 1.
Figure 3
Figure 3. Interaction of K-RasB-K175A with Ca2+/CaM at 25.0°C.
Fluorescence spectra (A) of 1.0 µM dansyl-CaM in the absence and in the presence of K-RasB-K175A-GppNHp at different concentrations. The arrow represents the concentration of K-RasB-K175A increases gradually from 0 (the bottom) to 14.0 µM (the top). ΔFF max for the binding of K-RasB-K175A to Ca2+/CaM plotted as a function of the concentration of K-RasB-K175A (B). The solid squares were the experimental data and the solid line represented the best fit. The panel C represents typical calorimetric titration of K-RasB-K175A (35.0 µM) with CaM (800 µM) in the presence of 1 mM CaCl2. The panel D shows the plots of the heat evolved (kcal) per mole of CaM added, corrected for the heat of CaM, against the molar ratio of CaM to K-RasB-K175A. The data (solid squares) were fitted to a single set of identical sites model and the solid line represented the best fit. The corresponding parameters from B and D are summarized in Table 1.
Figure 4
Figure 4. Interaction of H-Ras, K-RasB-(DESGPC), and H-Ras-(KKKKKK) with Ca2+/CaM at 25.0°C.
The panels A, B, and C represent typical calorimetric titration of H-Ras-GppNHp (30.0 µM), K-RasB-(DESGPC)-GppNHp (25.0 µM) and H-Ras-(KKKKKK)-GppNHp (25.0 µM) with CaM (300 µM) respectively in the presence of 1 mM CaCl2. The panels D, E, and F show the plots of the heat evolved (kcal) per mole of CaM added, corrected for the heat of CaM, against the molar ratio of CaM to Ras proteins. The data (solid squares) were fitted to a single set of identical sites model and the solid line represented the best fit.
Figure 5
Figure 5. Interaction of farnesylated K-RasB with Ca2+/CaM at 25.0°C.
Fluorescence spectra (A) of 1.0 µM dansyl-CaM in the absence and in the presence of GppNHp bound K-RasB-farn at different concentrations. The arrow represents the concentration of K-RasB-farn increases gradually from 0 (the bottom) to 3.3 µM (the top). ΔFF max for the binding of K-RasB-farn to Ca2+/CaM plotted as a function of the concentration of K-RasB-farn (B). The solid squares were the experimental data and the solid line represented the best fit. The panel C represents typical calorimetric titration of K-RasB-farn (30.0 µM) with CaM (600 µM) in the presence of 1 mM CaCl2. The panel D shows the plots of the heat evolved (kcal) per mole of CaM added, corrected for the heat of CaM, against the molar ratio of CaM to K-RasB. The data (solid squares) were fitted to a single set of identical sites model and the solid line represented the best fit. The corresponding parameters from B and D are summarized in Table 1.
Figure 6
Figure 6. Interaction of farnesylated K-RasB-K175A with Ca2+/CaM at 25.0°C.
Fluorescence spectra (A) of 1.0 µM dansyl-CaM in the absence and in the presence of GppNHp bound K-RasB-K175A-farn at different concentrations. The arrow represents the concentration of K-RasB-K175A-farn increases gradually from 0 (the bottom) to 8.4 µM (the top). ΔFF max for the binding of K-RasB-K175A-farn to Ca2+/CaM plotted as a function of the concentration of K-RasB-K175A-farn (B). The solid squares were the experimental data and the solid line represented the best fit. The panel C represents typical calorimetric titration of K-RasB-K175A-farn (25.0 µM) with CaM (600 µM) in the presence of 1 mM CaCl2. The panel D shows the plots of the heat evolved (kcal) per mole of CaM added, corrected for the heat of CaM, against the molar ratio of CaM to K-RasB. The data (solid squares) were fitted to a single set of identical sites model and the solid line represented the best fit. The corresponding parameters from B and D are summarized in Table 1.

References

    1. Barbacid M. ras genes. Annu Rev Biochem. 1987;56:779–827. - PubMed
    1. Bos JL. ras oncogenes in human cancer: a review. Cancer Res. 1989;49:4682–4689. - PubMed
    1. Downward J. Targeting Ras signalling pathways in cancer therapy. Nat Rev Cancer. 2003;3:11–22. - PubMed
    1. Hancock JF. Ras proteins:different signals from different locations. Nat Rev Mol Cell Biol. 2003;4:373–384. - PubMed
    1. Klee CB, Crouch TH, Richman PG. Calmodulin. Annu Rev Biochem. 1980;49:489–515. - PubMed

Publication types

MeSH terms