. 2011 Jul 1;2(7):2035-46.
doi: 10.1364/BOE.2.002035. Epub 2011 Jun 23.

Fast two-layer two-photon imaging of neuronal cell populations using an electrically tunable lens

Fast two-layer two-photon imaging of neuronal cell populations using an electrically tunable lens

Benjamin F Grewe et al. Biomed Opt Express. .

Abstract

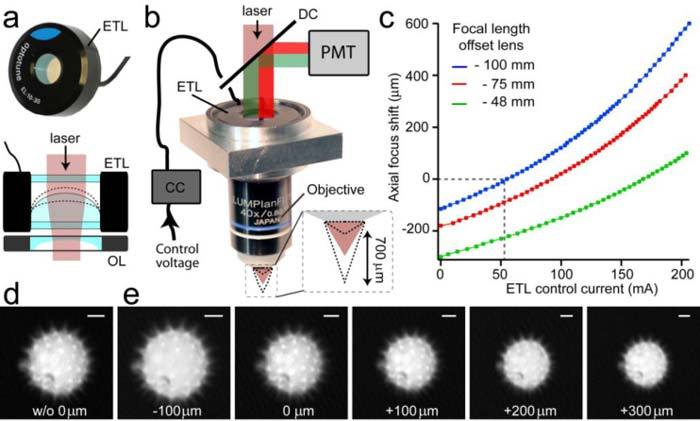
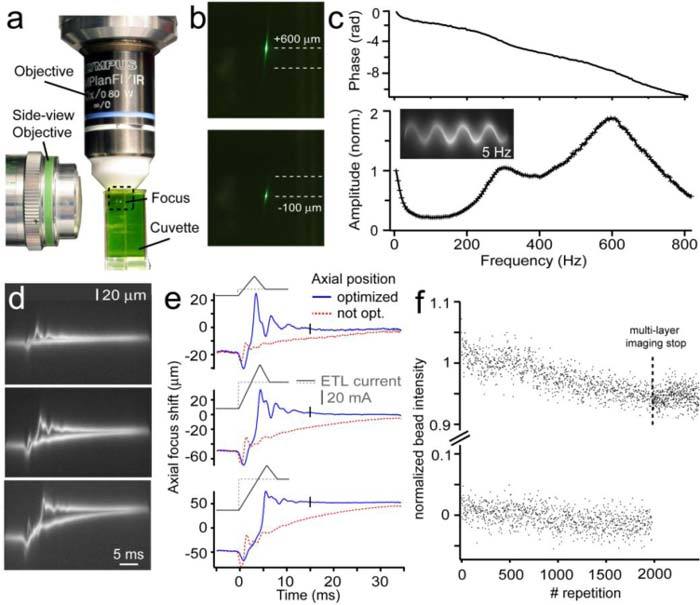
Functional two-photon Ca(2+)-imaging is a versatile tool to study the dynamics of neuronal populations in brain slices and living animals. However, population imaging is typically restricted to a single two-dimensional image plane. By introducing an electrically tunable lens into the excitation path of a two-photon microscope we were able to realize fast axial focus shifts within 15 ms. The maximum axial scan range was 0.7 mm employing a 40x NA0.8 water immersion objective, plenty for typically required ranges of 0.2-0.3 mm. By combining the axial scanning method with 2D acousto-optic frame scanning and random-access scanning, we measured neuronal population activity of about 40 neurons across two imaging planes separated by 40 μm and achieved scan rates up to 20-30 Hz. The method presented is easily applicable and allows upgrading of existing two-photon microscopes for fast 3D scanning.

Keywords: (170.0180) Microscopy; (170.2520) Fluorescence microscopy; (180.2520) Fluorescence microscopy; (180.4315) Nonlinear microscopy; (180.6900) Three-dimensional microscopy.


Figures

Fig. 1
Fig. 1
Optical setup and focusing properties of the electrically tunable lens. (a) Upper panel: Electrically tunable lens (ETL). Lower panel: lens assembly consisting of the ETL and the offset lens (OL). (b) Microscope adaptor to mount and align the ETL/OL assembly with respect to the microscope objective and excitation/detection pathways. DC dichroic beam splitter, PMT photomultiplier, CC current control driver. (c) Electrical focusing behavior of the ETL/OL system shown in (b) for three different plano-concave offset lenses (focal lengths: −100 mm/blue, −75 mm/red, −48 mm/green) in combination with the 40x objective. The axial focus shift was measured by refocusing small fluorescent beads using the motorized z-stage of the microscope. (d) Two-photon image (taken with the AOD microscope) of a pollen grain imaged without the ETL/OL assembly inserted. (e) The same pollen grain imaged through the ETL/OL/Objective assembly at different axial focus shifts. The pollen grain was refocused to the imaging plane in (d) using a motorized z-stage. Note the change in magnification or field-of-view size. Scale bars, 5 μm.
Fig. 2
Fig. 2
Optical evaluation of the axial scanning method. (a) Side-view of the z-variations in FOV size visualized by line scans in a glass cuvette containing a Fluorescein solution. (b) Relative change of the field-of-view (FOV) size with axial focus shift with respect to the FOV size without ETL. The simulated change in FOV size is shown as dashed lines. (c) 2D ray tracing layout of the ETL/OL assembly with the microscope objective (OBJ) attached. The simulation was calculated for optimum filling of the ETL/Objective back aperture (BA). The change in NA with axial focus shift is apparent. (d) Upper panel: PSF measurements with and without the ETL/OL assembly at the zero z-position using a galvanometric scan mirror based two-photon microscope. All values are stated as PSF half-widths in μm. The fluorescent beads used were 500 nm in size (Fluoresbrite, Polysciences Inc.). Lower panel: Simulated Strehl ratios of the entire excitation path (with underfilled back aperture) at 850 nm as a function of distance to the optical axis and axial focus shift. Up to a distance of 200 μm from the optical axis, diffraction-limited performance can be maintained (Strehl ratio > 0.8).
Fig. 3
Fig. 3
Dynamical properties of the ETL. (a) Optical oscilloscope setup using a side-viewing microscope focused at the two-photon excited fluorescent spot in a cuvette containing a Fluorescein solution. (b) Magnified image as indicated in (a) shows the maximum axial focal shift of 700 μm using a f = −100 mm concave OL and the 40x objective. (c) Frequency-dependence of direct phase (upper panel) and amplitude normalized to the value at 1 Hz (lower panel) of the ETL/OL/Objective axial scanning system in response to a sinusoidal driving current. Two broad resonance peaks at 300 and 600 Hz are discernible (5 Hz step size). Traces recorded with an eight second exposure time; according to the applied sinusoidal driving signals (5-820 Hz) 40-6560 traces were averaged. Example image shows a typical trace recorded for 5 Hz ETL oscillation frequency. (d) Optical oscilloscope traces showing step response and response using an optimized driving signal. In each case 200 traces were recorded. (e) Registered optical oscilloscope traces after image processing showing the step response with and without optimizing the ETL-current driving signal (gray traces on top of the reconstructed step responses) for different axial steps around the focus position without ETL/OL (z = 0). Employing optimized driving signals axial target positions were reached after 15 ms (indicated by black ticks). (f) Measurements of normalized bead intensities using the AOD frame scanning (5 Hz frame rate) at two different focal depths (step size 35 μm) during 2000 repetitions. Note: Beads were in focus only when switching to the upper axial layer. The position accuracy of axial positioning was then derived offline by a deconvolution of the normalized bead intensity (measured at the center of the bead) with the z-resolution of the AOD microscope (7.9 μm). Our analysis revealed an axial accuracy below 1 μm (±0.42 μm).
Fig. 4
Fig. 4
Two-photon two-layer calcium imaging in mouse neocortex. (a) Two-photon images of a neuronal cell population (green) stained with OGB-1 in L2/3 throughout mouse neocortex starting at 100 μm below the pia. (b) Schematic drawing of two-layer frame scanning and two-layer random-access pattern scanning at different depths. (c) Upper panels: Two L2/3 neuronal cell populations (gray) labeled with OGB-1-AM in mouse barrel cortex. Calcium imaging of neuronal cell populations was performed at different depths below pia mater (left image 180 μm, right image 140 μm). Scale bar, 20 μm. Lower panel: Neuronal activity signals (expressed as relative percentage fluorescence changes ΔF/F) were recorded at 6-Hz frame scanning rate (3 Hz per plane). To induce neuronal activity repeated brief air-puffs were applied to the mouse contralateral whiskers (indicated by black arrows). (d) Upper panels: Two-photon images of a neuronal cell population (gray) stained with OGB-1. Images are recorded at different focal depths (left image 273 μm, right image 233 μm) in mouse barrel cortex. The preselected random-access scanning positions on neuronal somata are shown as blue dots. Scale bar, 20 μm. Lower panel: Fast two-layer imaging was performed using 9-point RAPS targeted to 40 spots (17 cells for each layer plus background spots) that were manually pre-selected from the two reference images. Relative fluorescence traces (ΔF/F, 12 example cells shown) were recorded during short air-puff stimulations of the contralateral whiskers (black arrows). Effective sampling rate was 21.6 Hz. In vivo imaging experiments in (c) and (d) were performed using the 100 mm offset lens.

References

    1. Helmchen F., Denk W., “Deep tissue two-photon microscopy,” Nat. Methods 2(12), 932–940 (2005).10.1038/nmeth818 - DOI - PubMed
    1. Grewe B. F., Helmchen F., “Optical probing of neuronal ensemble activity,” Curr. Opin. Neurobiol. 19(5), 520–529 (2009).10.1016/j.conb.2009.09.003 - DOI - PubMed
    1. Kerr J. N., Denk W., “Imaging in vivo: watching the brain in action,” Nat. Rev. Neurosci. 9(3), 195–205 (2008).10.1038/nrn2338 - DOI - PubMed
    1. Göbel W., Kampa B. M., Helmchen F., “Imaging cellular network dynamics in three dimensions using fast 3D laser scanning,” Nat. Methods 4(1), 73–79 (2007).10.1038/nmeth989 - DOI - PubMed
    1. Grewe B. F., Langer D., Kasper H., Kampa B. M., Helmchen F., “High-speed in vivo calcium imaging reveals neuronal network activity with near-millisecond precision,” Nat. Methods 7(5), 399–405 (2010).10.1038/nmeth.1453 - DOI - PubMed

LinkOut - more resources