Comparative Study
. 2012 Mar;8(1):150-62.
doi: 10.1007/s12015-011-9301-3.

Dissecting the first transcriptional divergence during human embryonic development

Affiliations
Comparative Study

Dissecting the first transcriptional divergence during human embryonic development

Qiang Bai et al. Stem Cell Rev Rep. 2012 Mar.

Abstract

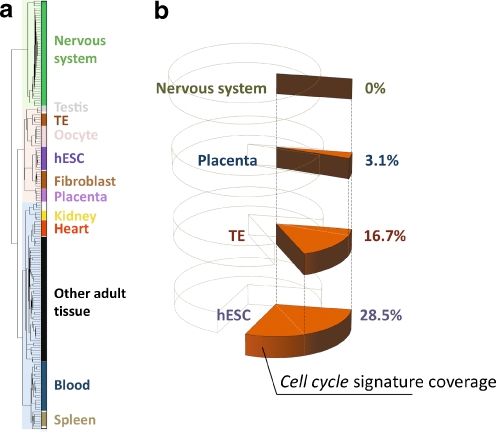
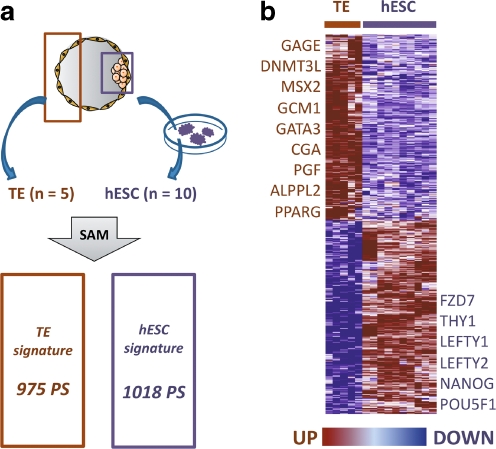
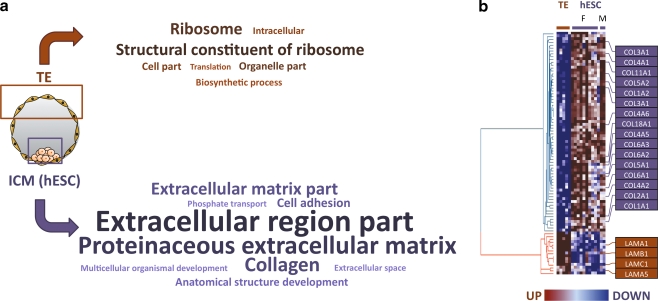
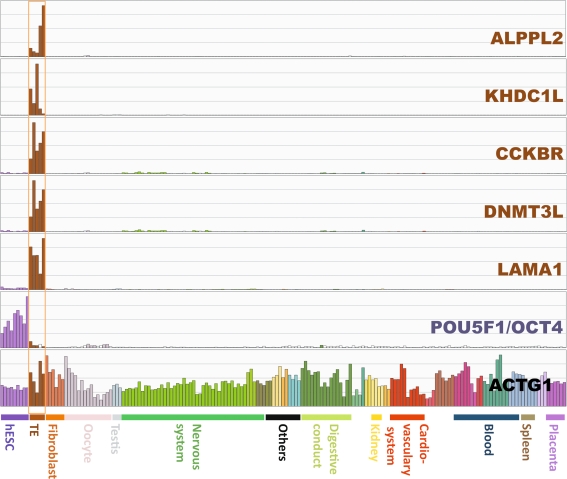
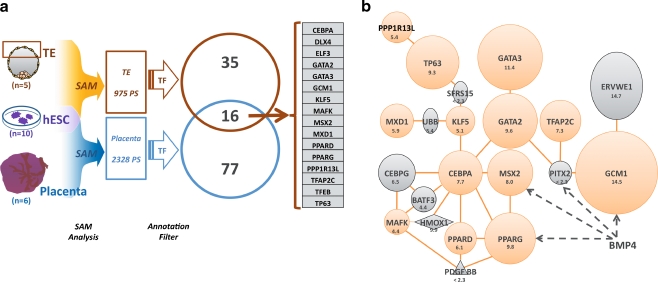
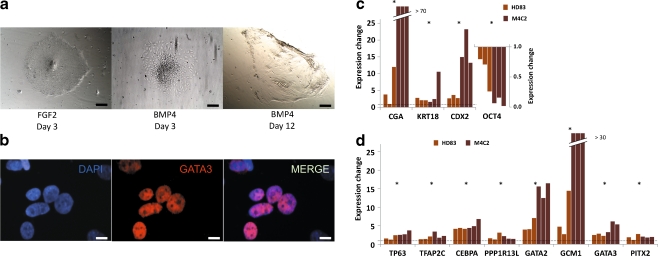
The trophoblast cell lineage is specified early at the blastocyst stage, leading to the emergence of the trophectoderm and the pluripotent cells of the inner cell mass. Using a double mRNA amplification technique and a comparison with transcriptome data on pluripotent stem cells, placenta, germinal and adult tissues, we report here some essential molecular features of the human mural trophectoderm. In addition to genes known for their role in placenta (CGA, PGF, ALPPL2 and ABCG2), human trophectoderm also strongly expressed Laminins, such as LAMA1, and the GAGE Cancer/Testis genes. The very high level of ABCG2 expression in trophectoderm, 7.9-fold higher than in placenta, suggests a major role of this gene in shielding the very early embryo from xenobiotics. Several genes, including CCKBR and DNMT3L, were specifically up-regulated only in trophectoderm, indicating that the trophoblast cell lineage shares with the germinal lineage a transient burst of DNMT3L expression. A trophectoderm core transcriptional regulatory circuitry formed by 13 tightly interconnected transcription factors (CEBPA, GATA2, GATA3, GCM1, KLF5, MAFK, MSX2, MXD1, PPARD, PPARG, PPP1R13L, TFAP2C and TP63), was found to be induced in trophectoderm and maintained in placenta. The induction of this network could be recapitulated in an in vitro trophoblast differentiation model.


Figures

Fig. 1
Fig. 1
Overview of TE expression profile and expression of cell cycle-specific genes in TE, hESCs, placenta and nervous system. a Unsupervised hierarchical clustering of the 181 panel samples. The first 30000 PS with the highest coefficient variation were analyzed with the Cluster software. Three cluster branches emerged: the nervous system branch (green), embryonic development and gamete branch (pink) and adult tissue branch (blue). b Proportion of genes from the cell cycle signature that are present in the TE, hESC, placenta and nervous system gene signatures
Fig. 2
Fig. 2
TE and hESC gene signatures. a Comparison of TE and hESC transcriptomes by significance analysis of microarray (SAM) identified two main gene signatures: the TE signature included 975 PS and the hESC signature 1018 PS. PS, probesets. b Heat map of the two signatures in the 5 TE and 10 hESC samples
Fig. 3
Fig. 3
Gene Ontology analysis of the TE and hESC signatures. a A Gene Ontology (GO) term enrichment analysis was carried out using FatiGO+. Only the GO terms that are significantly different (using adjusted p-values) between the two signatures are shown. A tag cloud shows the significant GO terms in each signature. The character size of each tag is proportional to their significance (see Materials and Methods). The details and the adjusted p-value of each term are shown in Supplementary Figure S2. b Heat map of the expression of all the extracellular matrix genes tagged by the GO term: 0031012 in the TE and hESC signatures showing the strong differential expression of extracellular matrix gene families in TE and hESC samples
Fig. 4
Fig. 4
Expression profile of five TE-specific genes in the panel of samples. The specific over-expression of ALPPL2, KHDCL1, CCKBR, DNMTL3 and LAMA1 in TE samples in comparison to all the other embryonic or adult samples of the panel is illustrated by bar graphs obtained using the Amazonia! gene atlas explorer (http://www.amazonia.transcriptome.eu). OCT4, a pluripotency gene, and ACTG1, a housekeeping gene, are also included
Fig. 5
Fig. 5
A core transcription factor (TF) network is over-expressed in TE samples and maintained also in mature placenta samples. a Comparison of the placenta and TE transcriptomes to the hESC transcriptome identified 16 transcription factors (TFs) that are over-expressed in both TE and placenta. b Among these 16 TFs, a network of 13 TFs (in orange) was found with the help of IPA (Ingenuity). The size of the circles representing the TFs is proportional to their fold change in expression between TE and hESCs. The genes in grey were added by IPA to form the network: these genes are expressed in TE and placenta, but without being significantly over-expressed. Four genes in this network are induced by BMP4 according to the IPA analysis
Fig. 6
Fig. 6
Induction of the TE core transcriptional circuitry induction is recapitulated during in vitro differentiation of pluripotent stem cells into trophoblast cells. a Trophoblast differentiation of pluripotent stem cells was induced by adding BMP4. Morphological changes of the hESC line HD83 cultured on Matrigel in MEF-conditioned medium after 3 days in the presence of 10 ng/mL FGF2 (left panel, negative control) or 10 ng/mL BMP4 (middle panel), and after 12 days with 10 ng/mL BMP4. Scale bar is 50 μm. b Immunofluorescence analysis showing the nuclear expression of GATA3 in HD83 cells after 5 days with BMP4. Scale bar is 10 μm. c After 5 days in the presence of 10 ng/mL BMP4, the hESC line HD83 and the iPS cell line M4C2 displayed increased expression of known trophoblast markers (CGA, KRT18 and CDX2) and decreased expression of the pluripotency marker OCT4. Expression changes were calculated by normalizing the gene expression first to the expression of the housekeeping gene GAPDH and then to gene expression in FGF2-treated control cells. * p < 0.05 and dashed line indicates the 1 fold change level. d The expression of GATA2, GATA3, GCM1, TB63, TFAP2C, CEBPA, PPP1R13L and PITX2 (TE core transcriptional regulatory circuitry) was significantly up-regulated in differentiated hESC and iPS cells (5 days with BMP4). * p < 0.05 and dashed line indicates the 1-fold change level

References

    1. Wong, C. C., Loewke, K. E., Bossert, N. L., et al. Non-invasive imaging of human embryos before embryonic genome activation predicts development to the blastocyst stage. Nature Biotechnology, 28, 1115–1121. - PubMed
    1. Arnold SJ, Robertson EJ. Making a commitment: cell lineage allocation and axis patterning in the early mouse embryo. Nature Reviews. Molecular Cell Biology. 2009;10:91–103. doi: 10.1038/nrm2618. - DOI - PubMed
    1. Evans MJ, Kaufman MH. Establishment in culture of pluripotential cells from mouse embryos. Nature. 1981;292:154–156. doi: 10.1038/292154a0. - DOI - PubMed
    1. Tanaka S, Kunath T, Hadjantonakis AK, Nagy A, Rossant J. Promotion of trophoblast stem cell proliferation by FGF4. Science. 1998;282:2072–2075. doi: 10.1126/science.282.5396.2072. - DOI - PubMed
    1. Senner CE, Hemberger M. Regulation of early trophoblast differentiation—lessons from the mouse. Placenta. 2010;31:944–950. doi: 10.1016/j.placenta.2010.07.013. - DOI - PubMed

Publication types

MeSH terms

Substances