. 2011 Sep;34(3):577-84.
doi: 10.1002/jmri.22712. Epub 2011 Jul 12.

Four-dimensional velocity mapping of the hepatic and splanchnic vasculature with radial sampling at 3 tesla: a feasibility study in portal hypertension

Affiliations

Four-dimensional velocity mapping of the hepatic and splanchnic vasculature with radial sampling at 3 tesla: a feasibility study in portal hypertension

A Frydrychowicz et al. J Magn Reson Imaging. 2011 Sep.

Abstract

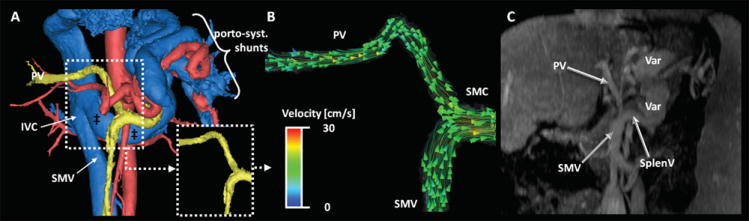
Purpose: To demonstrate the feasibility of PC-VIPR (Phase Contrast Vastly undersampled Imaging with Projection Reconstruction) for the depiction and hemodynamic analysis of hepatic and splanchnic vessels in patients with portal hypertension.

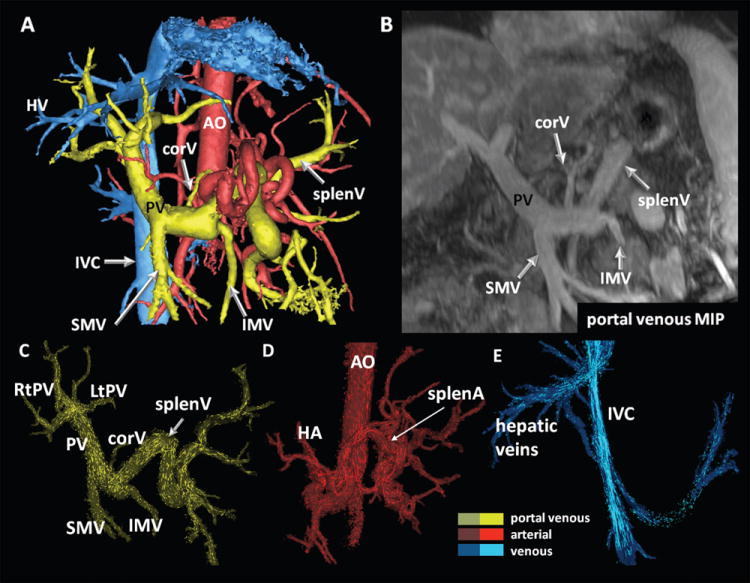
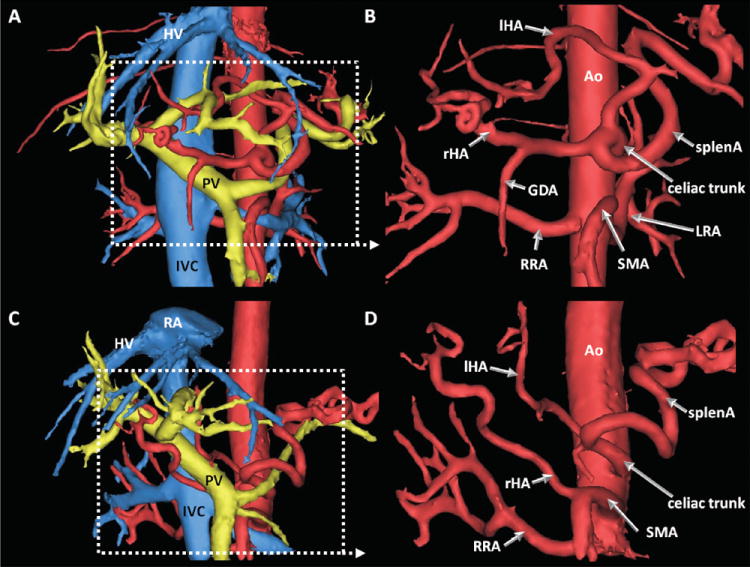
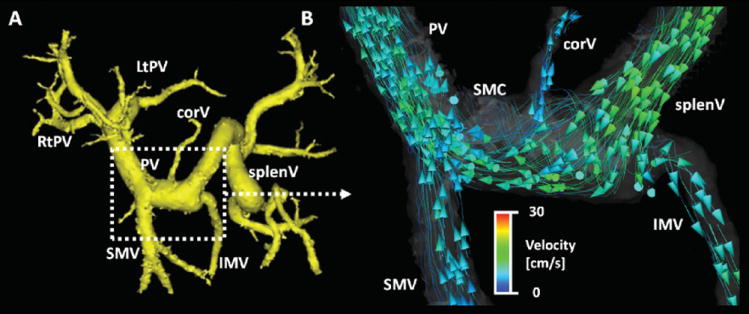
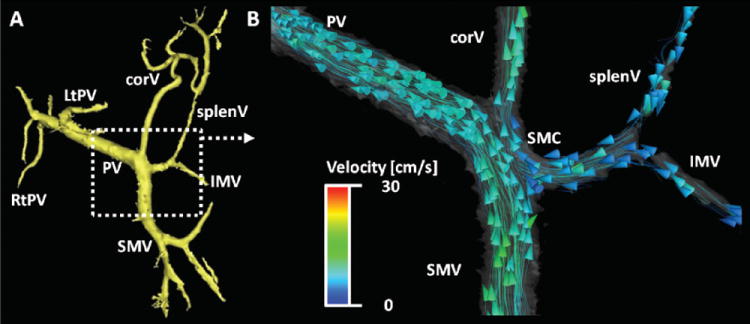
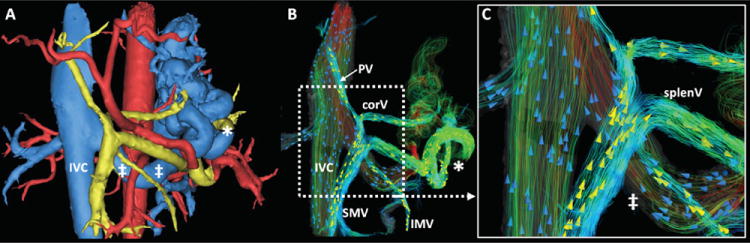
Materials and methods: Twenty-four cirrhotic patients (55.9 ± 10.4 years) were scanned using 5-point PC-VIPR for high spatial resolution imaging with large volume coverage at 3 Tesla (T) using a 32-channel body coil. Vessel segmentation and hemodynamic visualization included color-coded three-dimensional (3D) streamlines and particle traces. Segmentation quality was compared with contrast-enhanced multi-phase liver imaging. Flow pattern analysis was performed in consensus of three readers. The MELD score was calculated to estimate disease severity and was correlated to image quality.

Results: Good to excellent visualization quality was achieved in 23/24 cases. All arterial vessels and 144/168 vessels of the portal venous (PV) circulation were unambiguously identified. No correlation with the MELD score was found. Eight of 148 vessels of the PV circulation demonstrated reverse (hepatofugal) flow. Hepatofugal flow in small tributaries to PV flow were present in three cases despite hepatopetal flow in the PV.

Conclusion: This feasibility study demonstrates the feasibility of PC-VIPR for simultaneous morphological and hemodynamic assessment of the hepatic and splanchnic vasculature in cirrhosis and portal hypertension. Future studies with quantitative analyses are warranted.


Figures

Figure 1
Figure 1
Segmentation results (A) and segmental hemodynamic visualization using 3D particle traces on basis of previous vessel segmentation (C-E) in a 59 year-old patient with cryptogenic cirrhosis and multiple regenerative nodules. In (B), a MIP representation of the portal venous phase analyzed in standard axial views is displayed for comparison. (A) shows the large volume coverage and details that can be acquired with 5-point PC-VIPR. Data is displayed during systole. Particle trace emission was performed from the entire volume previously segmented thus eliminating the need to place multiple planes for emission of tracers. Color coding was performed with respect to vascular systems: yellow = portal venous, blue = venous, red = arterial. PV = portal vein; SMV, IMV = superior and inferior mesenteric vein; splenV = splenic vein; corV = coronary vein; HA = hepatic artery; splenA = splenic artery; AO – abdominal aorta; IVC = inferior vena cava.
Figure 2
Figure 2
Complete segmentation (left) and arterial segmentation only (right) of data with variants of the hepatic arterial system. Arterial segmentation seen from 15° RAO. With its volumetric coverage, PC VIPR allowed identification of true left (A, B) and variant hepatic arteries (C, D). In A and B, a 49yo male patient with HCC and chronic cirrhosis showed a left hepatic artery (lHA) originating from the celiac trunk. C and D are images from a 42yo female patient who presented with unclear hepatic masses. In her, the right hepatic artery (rHA) branches off the superior mesenteric artery (SMA) while the left (lHA) is originating from the celiac trunk. RA = right atrium, HV = hepatic vein, PV = portal vein, ICV = inferior vena cava, RRA = right renal artery, LRA = left renal artery, GDA = gastroduodenal artery, Ao = aorta.
Figure 3
Figure 3
59 year-old man with cirrhosis (MELD score = 8) and portal hypertension (same patient as in Figure 1). After segmentation of the portal venous system (A, yellow), the detailed blood flow analysis using particle traces in (B) shows hepatopetal flow in the portal vein (PV) and its main contributing branches splenic vein (splenV) and superior mesenteric vein (SMV). It is of special note, however, that due to his mild portal hypertension there is hepatofugal flow in the coronary vein (corV) and inferior mesenteric vein (IMV) only. This observation emphasizes the advantage of using 5-point PC VIPR which captures a large volume of interest and is not limited by, e.g., insonation angles or windows due to bowel gas. In B), curved streamlines with arrowheads indicating their direction have been used to better depict the finding. This visualization approach was not part of the study. The study data of this patient in displayed in Figure 1 and 2. Color-coding in (B) is performed with respect to the absolute acquired velocities. SMC = spleno-mesenteric confluence.
Figure 4
Figure 4
70 year-old female with known cirrhotic liver disease (MELD score = 8). After segmentation of 5-point PC VIPR flow data in MIMICS (A), flow dynamics visualized in EnSIght (CEI, Apex, NC) can be appreciated in B. Interestingly, most vessels show hepatopetal flow (PV, SMV, splenV, and IMV). Only the flow in the coronary vein (corV) was shown to be hepatofugal. Of note is the contribution of flows on the basis of the flow field: The flow is predominantly from the SMV into the PV, while splenic and inferior mesenteric vein flows (splenV and IMV, respectively) are channeled primarily into the coronary vein. Flow traces suggest that there is only minimal mixing. This may be important for predicting levels of hepatic encephalopathy. Color-coding in (B) is performed with respect to the absolute acquired velocities.
Figure 5
Figure 5
23 year-old woman with secondary (biliary) cirrhosis after obstructive Type A choledochal cyst. A Kasai porto-enterostomy with Roux-en-Y anastomosis was performed during infancy (24). The patient presented with rising bilirubin and a MELD score of 19. In A) the segmentation using MIMICS shows the portal venous system (yellow) with large porto-systemic shunts via the spleno-renal pathway. Note the markedly enlarged left renal vein (‡) draining in the IVC at the level of the white arrow. Hemodynamic visualization shows the hepatofugal flow in the portal venous system. Color-coding in (B) is performed with respect to the absolute acquired velocities. (C) is a MIP depiction of the portal venous phase LAVA sequence. Note that the comparative analysis was not performed on MIP reformats but standard axial views. PV = portal vein, SMV = superior mesenteric vein, SMC – spleno-mesenteric confluence.
Figure 6
Figure 6
59 year-old patient with alcoholic cirrhosis and hepatitis C, MELD score 10. Both MIMICS segmentation (A) and flow visualization with EnSight (B, C) show very large portosystemic collaterals. The full extent of flow to the shunt vessels (*) and return via the enlarged left renal vein (‡) can be appreciated in detail. B and C used 3D streamlines color-coded to the absolute measured velocity. Arrowheads were added in a random distribution to depict directionality (yellow arrowheads, portal venous streamlines; blue arrowheads, [systemic] venous streamlines). MIMICS segmentation (A): yellow: portal venous vasculature & contributing vessels; blue: systemic venous vasculature; red: arterial supply.

References

    1. McCullough AJ. Pathophysiology of nonalcoholic steatohepatitis. J Clin Gastroenterol. 2006;40(Suppl 1):S17–29. - PubMed
    1. Ratziu V, Bonyhay L, Di Martino V, et al. Survival, liver failure, and hepatocellular carcinoma in obesity-related cryptogenic cirrhosis. Hepatology. 2002;35(6):1485–1493. - PubMed
    1. Moreau R, Lebrec D. Molecular Mechanisms of Systemic Vasodilatation and Hyperdynamic Circulatory State of Cirrhosis. In: Sanyal AJ, Shah VH, editors. Portal Hypertension: Pathobiology, Evaluation, and Treatment, Clinical Gastroenterology. Totowa, NJ: Humana Press; 2005.
    1. Applegate GR, Thaete FL, Meyers SP, et al. Blood flow in the portal vein: velocity quantitation with phase-contrast MR angiography. Radiology. 1993;187(1):253–256. - PubMed
    1. Burkart DJ, Johnson CD, Morton MJ, Wolf RL, Ehman RL. Volumetric flow rates in the portal venous system: measurement with cine phase-contrast MR imaging. AJR Am J Roentgenol. 1993;160(5):1113–1118. - PubMed

Publication types