

Test-retest repeatability of MR elastography for noninvasive liver fibrosis assessment in hepatitis C
- PMID: 21751289
- PMCID: PMC3176946
- DOI: 10.1002/jmri.22716
Test-retest repeatability of MR elastography for noninvasive liver fibrosis assessment in hepatitis C
Abstract
Purpose: To conduct a rigorous evaluation of the repeatability of liver stiffness assessed by MR elastography (MRE) in healthy and hepatitis-C-infected subjects.
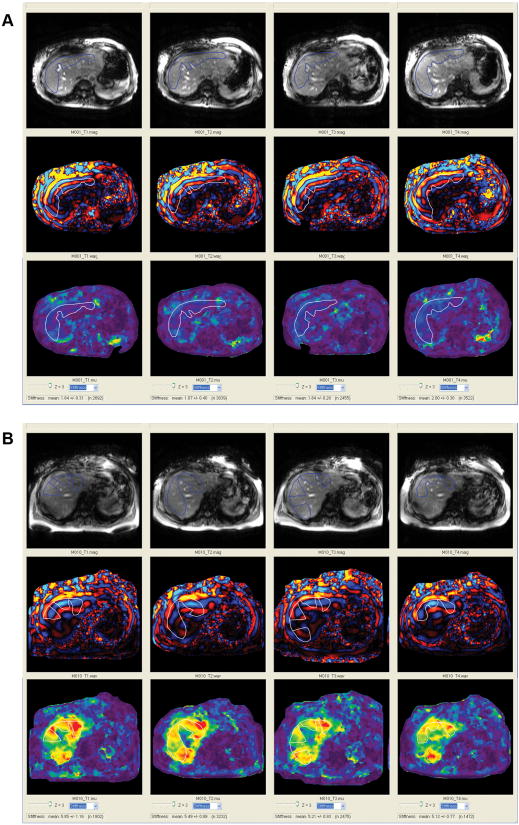
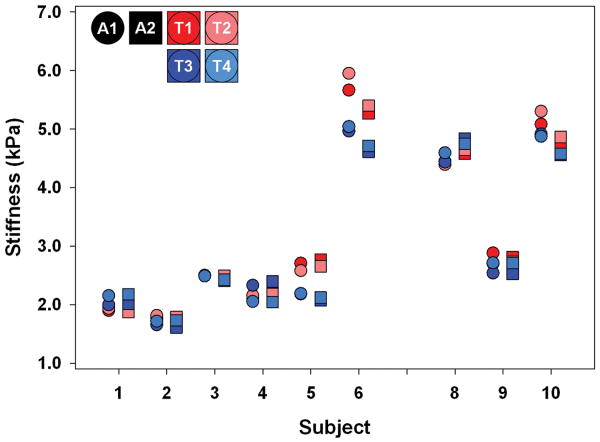
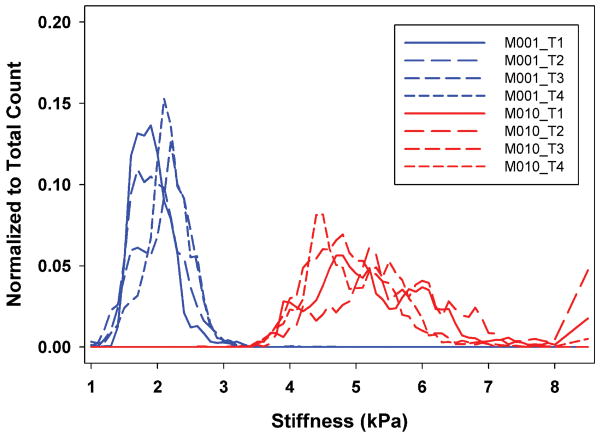
Materials and methods: A biopsy-correlated repeatability study using four-slice MRE was conducted in five healthy and four HCV-infected subjects. Subjects were scanned twice on day 1 and after 7-14 days. Each slice was acquired during a 14-s breath-hold with a commercially available acquisition technique (MR-Touch, GE Healthcare). Results were analyzed by two independent analysts.
Results: The intraclass correlation coefficient (ICC) was 0.85 (90% confidence interval [CI]: 0.71 to 0.98) for the between-scan average of maximum stiffness within each slice and 0.88 (90% CI: 0.78 to 0.99) for the average of mean stiffness within each slice for the primary analyst. For both analysts, the average of the mean liver stiffness within each slice was highly reproducible with ICC of 0.93 and 0.94. Within-subject coefficients of variation ranged from 6.07% to 10.78% for HCV+ and healthy subjects.
Conclusion: MRE is a highly reproducible modality for assessing liver stiffness in HCV patients and healthy subjects and can discriminate between moderate fibrosis and healthy liver. MRE is a promising modality for noninvasive assessment of liver fibrosis (CLINICALTRIALS.GOV IDENTIFIER: NCT00896233).
Copyright © 2011 Wiley-Liss, Inc.
Conflict of interest statement
Conflict of interest: Norah J. Shire, Radha A. Railkar, Sabrina Fox-Bosetti, Chan R. Beals, and Bernard J. Dardzinski are Merck employees and may own stock/stock options in Merck.
Figures
References
-
- Hepatitis C--global prevalence (update) Wkly Epidemiol Rec. 1999;74:425–427. - PubMed
-
- Di Bisceglie AM. Natural history of hepatitis C: its impact on clinical management. Hepatology. 2000;31:1014–1018. - PubMed
-
- Ghany MG, Kleiner DE, Alter H, et al. Progression of fibrosis in chronic hepatitis C. Gastroenterology. 2003;124:97–104. - PubMed
-
- Sebagh M, Rifai K, Feray C, et al. All liver recipients benefit from the protocol 10-year liver biopsies. Hepatology. 2003;37:1293–1301. - PubMed
-
- Strader DB, Wright T, Thomas DL, Seeff LB. Diagnosis, management, and treatment of hepatitis C. Hepatology. 2004;39:1147–1171. - PubMed
Publication types
MeSH terms
Associated data
Grants and funding
LinkOut - more resources
Full Text Sources
Medical
