. 2011 Oct;85(19):10058-68.
doi: 10.1128/JVI.05075-11. Epub 2011 Jul 13.

Cell-type-specific type I interferon antagonism influences organ tropism of murine coronavirus

Affiliations

Cell-type-specific type I interferon antagonism influences organ tropism of murine coronavirus

Ling Zhao et al. J Virol. 2011 Oct.

Abstract

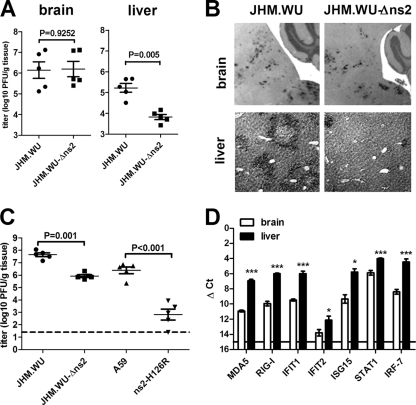
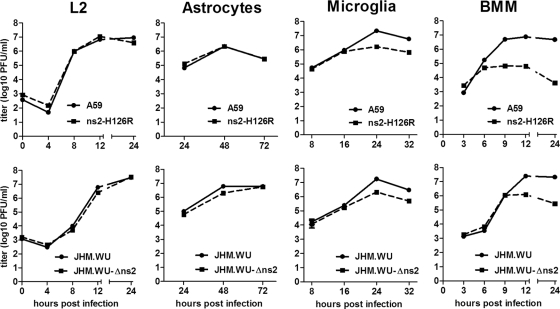
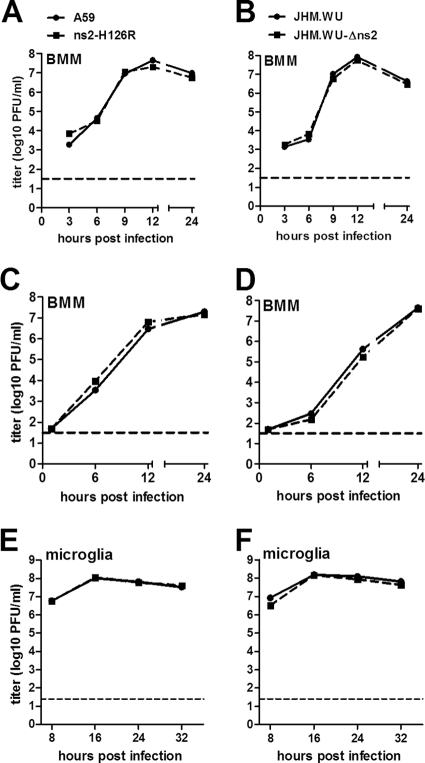
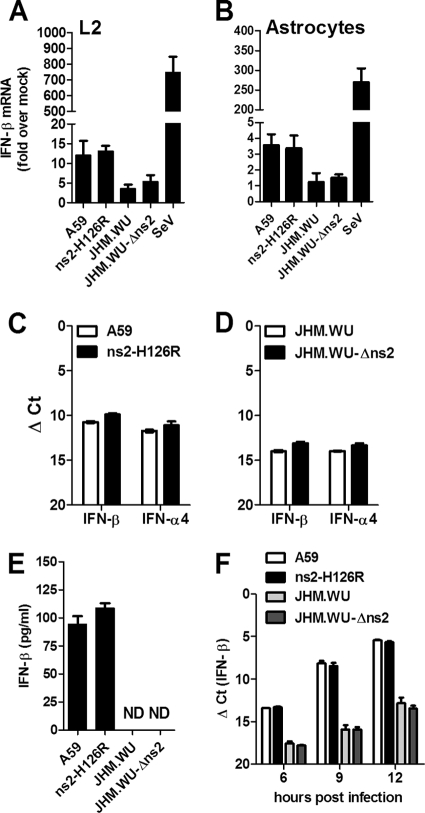
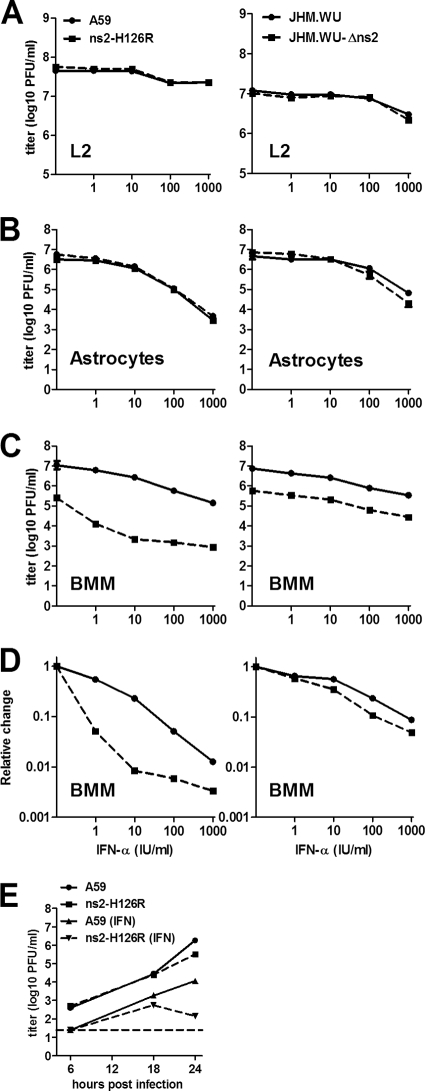
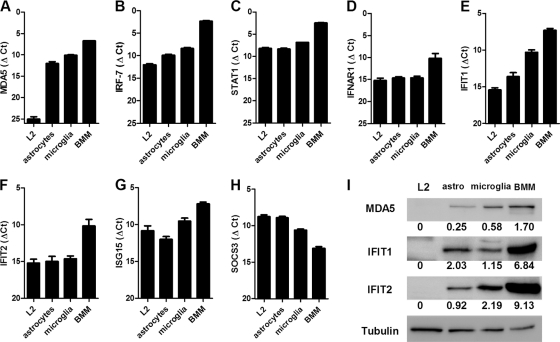
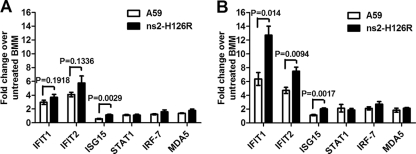
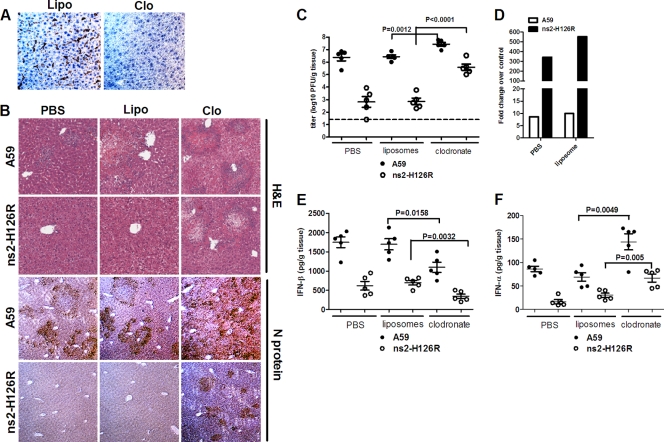
Previous studies have demonstrated that mouse hepatitis virus (MHV) hepatotropism is determined largely by postentry events rather than by availability of the viral receptor. In addition, mutation of MHV nonstructural protein 2 (ns2) abrogates the ability of the virus to replicate in the liver and induce hepatitis but does not affect replication in the central nervous system (CNS). Here we show that replication of ns2 mutant viruses is attenuated in bone marrow-derived macrophages (BMM) generated from wild-type (wt) mice but not in L2 fibroblasts, primary astrocytes, or BMM generated from type I interferon receptor-deficient (IFNAR(-/-)) mice. In addition, ns2 mutants are more sensitive than wt virus to pretreatment of BMM, but not L2 fibroblasts or primary astrocytes, with alpha/beta interferon (IFN-α/β). The ns2 mutants induced similar levels of IFN-α/β in wt and IFNAR(-/-) BMM, indicating that ns2 expression has no effect on the induction of IFN but rather that it antagonizes a later step in IFN signaling. Consistent with these in vitro data, the virulence of ns2 mutants increased to near that of wt virus after depletion of macrophages in vivo. These data imply that the ability of MHV to replicate in macrophages is a prerequisite for replication in the liver and induction of hepatitis but not for replication or disease in the CNS, underscoring the importance of IFN signaling in macrophages in vivo for protection of the host from hepatitis. Our results further support the notion that viral tissue tropism is determined in part by postentry events, including the early type I interferon response.


Figures

Fig. 1.
Fig. 1.
Replication of JHM.WU and JHM.WU-Δns2 in the brain and liver after i.c. inoculation. (A) Four- to 5-week-old B6 mice were infected i.c. with 10 PFU of JHM.WU or JHM.WU-Δns2 (n = 5). At day 5 postinfection, mice were sacrificed and the viral loads in the brain and liver were determined by plaque assay on L2 cells. The error bars represent the standard errors of the means (SEM). (B) MHV antigen was detected by staining with anti-MHV N monoclonal antibody (n = 3). (C) B6 mice were infected i.h. with 500 PFU of JHM.WU, JHM.WU-Δns2, A59, or ns2-H126R (n = 5). At day 5 postinfection, mice were sacrificed and viral loads in the liver were determined by plaque assay on L2 cells. The dashed line represents the limit of detection, and the error bars represent the SEM. (D) Livers and brains were harvested from uninfected B6 mice (n = 8), and total RNA was isolated. Basal mRNA levels of ISGs were quantified by qRT-PCR and normalized to the actin mRNA level [ΔCT = CT(ISG)CT(β-actin)]. The CT values for β-actin were approximately the same in the brain and the liver. The line represents the limit of detection, and the error bars represent the SEM. Asterisks indicate that differences are statistically significant (*, P < 0.05; **, P < 0.01; ***, P < 0.001). Data shown were derived from one representative experiment of two.
Fig. 2.
Fig. 2.
Mutation of the ns2 gene in the A59 and JHM.WU backgrounds attenuates viral replication in BMM and microglia. L2 cells, primary astrocytes, microglia, or BMM (as indicated) were infected with A59, ns2-H126R, JHM.WU, or JHM.WU-Δns2 at an MOI of 1 PFU/cell. At the indicated time points postinfection, cells were lysed in their medium by freeze-thawing, and titers were determined by plaque assay on L2 cells. The data are from one representative experiment of at least two, each performed in triplicate.
Fig. 3.
Fig. 3.
ns2 mutants replicate to the same extent as wt viruses in BMM and microglia from IFNAR−/− mice. IFNAR−/− BMM were infected with the indicated viruses at an MOI of 1 PFU/cell (A and B) or 0.01 PFU/cell (C and D), and IFNAR−/− microglia were infected at an MOI of 1 PFU/cell (E and F). At the indicated times postinfection, titers of viruses in the cell lysates and supernatants were determined by plaque assay on L2 cells. The data are from one representative experiment of two, each performed in triplicate.
Fig. 4.
Fig. 4.
ns2 does not antagonize IFN production. (A and B) L2 cells and primary astrocytes were infected with A59, ns2-H126R, JHM.WU, or JHM.WU-Δns2 at an MOI of 1 PFU/cell. At 24 h p.i., IFN-β mRNA was quantified by qRT-PCR. (C and D) BMM were infected with A59, ns2-H126R, JHM.WU, or JHM.WU-Δns2 at an MOI of 1. At 6 h p.i. for A59 and ns2-H126R and 9 h p.i. for JHM.WU and JHM.WU-Δns2, IFN-β and IFN-α4 mRNAs were quantified by qRT-PCR. (E) At 12 h p.i., IFN-β protein in the medium above infected BMM was quantified by ELISA. (F) IFNAR−/− BMM were infected with A59, ns2-H126R, JHM.WU, or JHM.WU-Δns2 at an MOI of 1 PFU/cell. The kinetics of IFN-β mRNA expression were quantified by qRT-PCR. The error bars represent the SEM (n = 4). ND, not detectable.
Fig. 5.
Fig. 5.
Mutation of ns2 confers increased sensitivity to IFN in BMM. Murine L2 fibroblasts (A), astrocytes (B), or BMM (C) were pretreated with increasing doses of IFN-α. Twenty-four hours after IFN-α treatment for L2 and astrocytes or 6 h after treatment for BMM, cells were infected with the indicated viruses at an MOI of 1 PFU/cell. At 18 h p.i. for L2, 48 h for astrocytes, and 14 h p.i. for BMM, virus titers (cell-associated and released titers combined) were determined by plaque assay on L2 cells. (D) Relative changes in virus titers in BMM. (E) Microglia were pretreated with 10 IU/ml of IFN-α or mock treated for 6 h and then infected with A59 or ns2-H126R at an MOI of 1 PFU/cell. At the indicated time points postinfection, virus titers (cell-associated and released titers combined) were determined by plaque assay on L2 cells. The data are from one representative experiment of two, performed in triplicate.
Fig. 6.
Fig. 6.
Basal ISG mRNA and protein expression in different cell types. RNAs were purified from uninfected BMM, microglia, and astrocytes derived from B6 mice. The basal levels of ISG mRNA expression, normalized to β-actin mRNA levels, were quantified by qRT-PCR. (A) MDA5; (B) IRF-7; (C) STAT1; (D) IRNAR1; (E) IFIT1; (F) IFIT2; (G) ISG15; (H) SOCS3. Data were derived from one representative experiment of two; the error bars represent the SEM (n = 4). (I) Basal protein expression levels of MDA5, IFIT1, IFIT2, and tubulin were assessed by Western immunoblotting. ISG protein levels were normalized to the tubulin level in each cell type; the ratio of ISG to tubulin is indicated below each band.
Fig. 7.
Fig. 7.
ns2 suppresses specific ISG mRNA expression in BMM. BMM were infected with A59 or ns2-H126R at an MOI of 1. At 6 h p.i., cells were treated with 1,000 IU/ml IFN-α. The cells were harvested at 0.5 (A) and 1 (B) h post-IFN-α treatment, and RNA was extracted. ISG mRNA expression was quantified by qRT-PCR (n = 4) and expressed as the fold change compared to untreated cells. The data were derived from one representative experiment of two. The error bars represent the SEM.
Fig. 8.
Fig. 8.
Macrophage depletion restores the virulence of ns2-H126R. Four-week-old B6 mice were injected intravenously in the tail vein with clodronate-liposomes. Control mice were similarly treated with PBS or empty liposomes. The next day, mice were injected intrahepatically with 500 PFU A59 or ns2-H126R or with PBS. (A) At 5 days postinfection, livers from mock-infected mice were harvested and stained for F4/80 (n = 3). (B) Liver sections were stained with hematoxylin and eosin to detect pathological changes and with anti-MHV N monoclonal antibody to detect viral antigen expression (n = 3). (C) Virus titers in A59- or ns2-H126R-infected livers were determined by plaque assay. The dashed line represents the limit of detection, and the error bars represent SEM (n = 5). (D) Fold change of virus titer of A59 or ns2-H126R in livers from mice treated with clodronate-liposomes versus livers from those treated with empty liposomes or PBS. IFN-β (E) and IFN-α (F) protein levels in A59- or ns2-H126R-infected livers were quantified by ELISA. The error bars represent SEM (n = 5).

Similar articles

Cited by

References

    1. Bender S. J., Phillips J. M., Scott E. P., Weiss S. R. 2010. Murine coronavirus receptors are differentially expressed in the central nervous system and play virus strain-dependent roles in neuronal spread. J. Virol. 84:11030–11044 - PMC - PubMed
    1. Bender S. J., Weiss S. R. 2010. Pathogenesis of murine coronavirus in the central nervous system. J. Neuroimmune Pharmacol. 5:336–354 - PMC - PubMed
    1. Caamano J., Alexander J., Craig L., Bravo R., Hunter C. A. 1999. The NF-kappa B family member RelB is required for innate and adaptive immunity to Toxoplasma gondii. J. Immunol. 163:4453–4461 - PubMed
    1. Cervantes-Barragan L., et al. 2009. Type I IFN-mediated protection of macrophages and dendritic cells secures control of murine coronavirus infection. J. Immunol. 182:1099–1106 - PubMed
    1. Cervantes-Barragan L., et al. 2007. Control of coronavirus infection through plasmacytoid dendritic-cell-derived type I interferon. Blood 109:1131–1137 - PMC - PubMed

Publication types

MeSH terms

Substances

LinkOut - more resources