. 2011 Sep;85(18):9588-98.
doi: 10.1128/JVI.05064-11. Epub 2011 Jul 13.

Human immunodeficiency virus rev-binding protein is essential for influenza a virus replication and promotes genome trafficking in late-stage infection

Affiliations

Human immunodeficiency virus rev-binding protein is essential for influenza a virus replication and promotes genome trafficking in late-stage infection

Amie J Eisfeld et al. J Virol. 2011 Sep.

Abstract

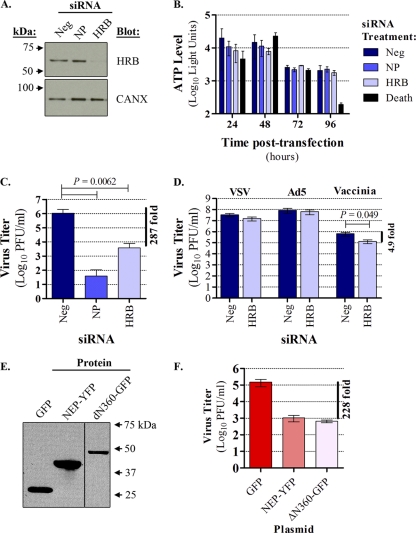
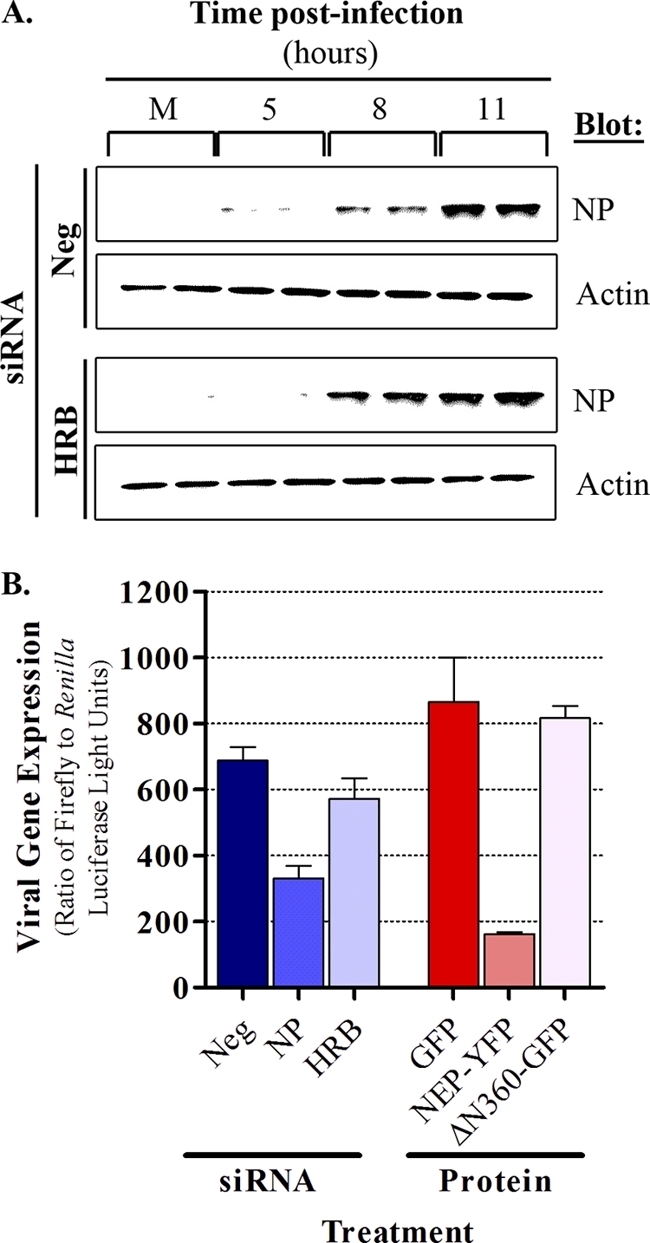
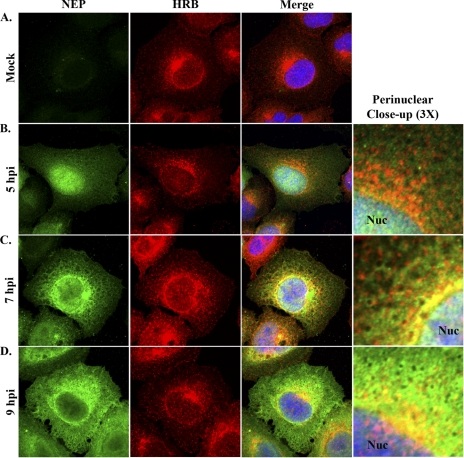
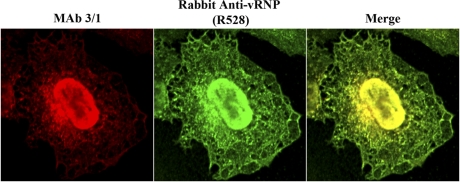
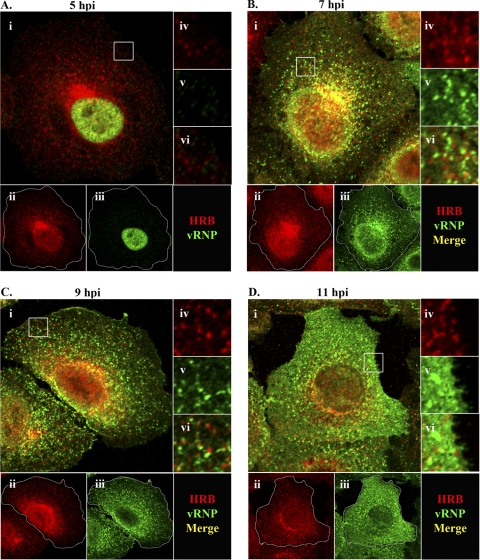
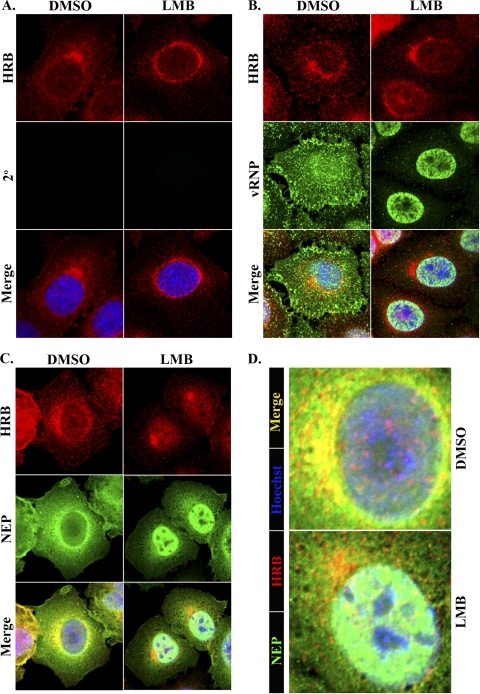
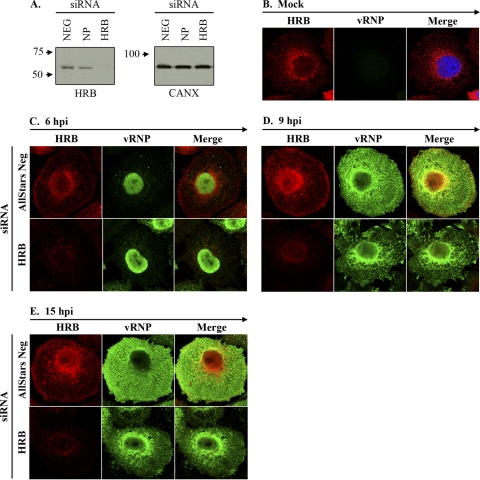
Influenza A virus uses cellular protein transport systems (e.g., CRM1-mediated nuclear export and Rab11-dependent recycling endosomes) for genome trafficking from the nucleus to the plasma membrane, where new virions are assembled. However, the detailed mechanisms of these events have not been completely resolved, and additional cellular factors are probably required. Here, we investigated the role of the cellular human immunodeficiency virus (HIV) Rev-binding protein (HRB), which interacts with influenza virus nuclear export protein (NEP), during the influenza virus life cycle. By using small interfering RNAs (siRNAs) and overexpression of a dominant negative HRB protein fragment, we show that cells lacking functional HRB have significantly reduced production of influenza virus progeny and that this defect results from impaired viral ribonucleoprotein (vRNP) delivery to the plasma membrane in late-stage infection. Since HRB colocalizes with influenza vRNPs early after their delivery to the cytoplasm, it may mediate a connection between the nucleocytoplasmic transport machinery and the endosomal system, thus facilitating the transfer of vRNPs from nuclear export to cytoplasmic trafficking complexes. We also found an association between NEP and HRB in the perinuclear region, suggesting that NEP may contribute to this process. Our results identify HRB as a second endosomal factor with a crucial role in influenza virus genome trafficking, suggest cooperation between unique endosomal compartments in the late steps of the influenza virus life cycle, and provide a common link between the cytoplasmic trafficking mechanisms of influenza virus and HIV.


Figures

Fig. 1.
Fig. 1.
HRB perturbation interferes with influenza virus growth. (A) 293 cells were transfected with a validated, nontargeting commercial negative-control siRNA (AllStars Neg; referred to as “Neg” in the figure), siRNA targeting influenza virus NP mRNA (NP), or siRNA targeting HRB, and total cell lysates were subjected to immunoblot analysis with mouse anti-HRB or rabbit anticalnexin (CANX; loading control) antibody. (B) Cell viability was measured using the CellTiter-Glo assay. 293 cells were transfected with siRNAs as described for panel A, except that a cell death-inducing siRNA mixture (Death) was also included. The data are represented as an average luciferase reading ± standard deviation (SD) for triplicate transfections. (C) Cells were transfected with siRNAs as described for panel A and were superinfected with influenza virus A/WSN/33 (WSN). At 48 h postinfection, supernatants were assayed for infectious virus by plaque assay in MDCK cells. The data shown are a compilation of three independent experiments, in which triplicate transfections were performed for each siRNA, and are represented as an average ± SD. A paired Student t test was used to compare replication in AllStars Neg siRNA-treated cells versus either NP or HRB siRNA treatments, and the P value is indicated above the graph. (D) 293 cells were transfected with AllStars Neg or HRB siRNA as described and infected with VSV, Ad5, or vaccinia virus. Infectious viruses from each condition were quantified as described in Materials and Methods. Paired Student t tests were performed to compare replication between the siRNA treatment conditions for each virus, and significant P values are indicated above the graph. Data are represented as means of triplicate transfections from two independent experiments ± standard errors of the means. (E) 293 cells were transfected with plasmids expressing GFP, NEP-YFP, or ΔN360-GFP, and expression levels were determined by immunoblot analysis of whole-cell lysates with anti-GFP antibodies at 48 h posttransfection. (F) At 48 h posttransfection, plasmid-transfected cells were superinfected with influenza virus WSN, and the level of infectious virus in supernatants was assayed by plaque assay in MDCK cells after 72 h. Data are represented as an average of triplicate infections performed for each transfection condition ± SD.
Fig. 2.
Fig. 2.
HRB is not required for early events in the influenza virus life cycle. (A) siRNA-treated 293 cells were mock infected or infected with influenza virus WSN at a multiplicity of infection (MOI) of 3 PFU per cell, and total cell lysates were subjected to immunoblot analysis with rabbit polyclonal antibody R528 (against influenza vRNP) or rabbit antiactin antibody (loading control) at different times after infection. siRNA treatments are indicated to the left, time points are shown at the top, and antibodies are to the right. Duplicate samples were prepared for each infection condition at each time point. (B) 293 cells were transfected with AllStars Neg (referred to as “Neg” in the figure), NP- or HRB-specific siRNAs, or plasmids expressing GFP, NEP-YFP, or ΔN360-GFP and were subsequently transfected with plasmids for the influenza virus WSN minireplicon assay. Viral gene expression levels were quantified as described in Materials and Methods. Data are represented as average ratios of firefly (viral)/Renilla (cellular) gene expression from triplicate transfections ± SD. M, Mock.
Fig. 3.
Fig. 3.
HRB and NEP distribution in influenza virus-infected cells. A549 cells were mock infected (A) or infected with influenza virus WSN (MOI, 3) and fixed with 4% paraformaldehyde at 5 (B), 7 (C), and 9 (D) hpi. Permeabilized cells were stained with rabbit polyclonal antiserum against influenza virus NEP (R5023) and a mouse monoclonal antibody against HRB, combined with AF 488-conjugated goat anti-rabbit and AF 546-conjugated goat anti-mouse antibodies and Hoechst 33258. Individual NEP (green) and HRB (red) staining patterns are shown for each time point, along with a merged panel including Hoechst nuclear staining. A 3× zoom highlighting the perinuclear region from the merged panels is shown in panels B to D. Nuc, nucleus.
Fig. 4.
Fig. 4.
Polyclonal rabbit anti-vRNP antibody (R528) identifies influenza vRNPs with specificities similar to that of monoclonal antibody 3/1. A549 cells were infected with WSN at an MOI of 3 PFU per cell and fixed with 4% paraformaldehyde at 9 hpi. Permeabilized cells were stained with R528 and monoclonal antibody 3/1 (MAb 3/1), combined with AF 488-conjugated goat anti-rabbit (green) and AF 546-conjugated goat anti-mouse (red) antibodies. Individual and merged staining patterns are shown.
Fig. 5.
Fig. 5.
vRNP and HRB spatiotemporal dynamics in influenza virus-infected cells. A549 cells were infected with influenza virus WSN (MOI, 3) and harvested at 5 (A), 7 (B), 9 (C), or 11 (D) hpi. Cells were stained with rabbit anti-vRNP (R528) and mouse anti-HRB antibodies, followed by AF 488-conjugated goat anti-rabbit (green) and AF 546-conjugated goat anti-mouse (red) antibodies. Representative staining profiles are shown, with the specific time points indicated at the top. For each panel, panel i shows a merged image of HRB and vRNP, and individual staining profiles are shown in panels ii and iii, respectively. In panel ii, white traces indicate the plasma membrane boundaries. Individual and merged stainings are also shown for enlargements (3×) of boxed regions from panel i: iv, HRB; v, vRNP; and vi, Merge. A staining key is shown in the lower right corner of each panel.
Fig. 6.
Fig. 6.
Leptomycin B (LMB) does not induce HRB nuclear accumulation. A549 cells were mock infected or infected with influenza virus WSN (MOI, 3), and at 4 hpi they were treated with LMB and further incubated with LMB for 5 h, followed by fixation in paraformaldehyde. (A) DMSO (control)- and LMB-treated mock-infected cells were stained with monoclonal mouse anti-HRB and AF 546-conjugated goat anti-mouse secondary antibodies. Infected, DMSO- or LMB-treated cells were stained as described in the legend to Fig. 5 (B) or Fig. 3 (C), respectively. All cells were counterstained with Hoechst 33258. Individual HRB (red) and vRNP or NEP (green) panels are shown, along with a merged panel including Hoechst. (A to C) Drug treatments are shown at the top, and specific stains are indicated to the left. (D) Enlarged images of the merged panels in panel C, highlighting HRB and NEP distribution around the periphery of the nucleus. A color key is shown at the left, and drug treatments are shown at the right.
Fig. 7.
Fig. 7.
HRB knockdown causes retention of vRNP in the perinuclear region. (A) Total cell lysates from AllStars Neg (referred to as “Neg” in the figure), NP, and HRB siRNA-treated HeLa cells at 48 h posttransfection were subjected to immunoblot analysis with mouse anti-HRB or rabbit anti-CANX (loading control). (B) Negative-control siRNA-treated HeLa cells were mock infected and subjected to staining with mouse anti-HRB and rabbit anti-vRNP (R528), followed by AF 546-conjugated goat anti-mouse and AF 488-conjugated goat anti-rabbit secondary antibodies. (C to E) HeLa cells treated with either negative control (AllStars Neg) or HRB siRNA were infected with influenza virus WSN (MOI, 5) and fixed at 6, 9, and 15 hpi. Cells were stained as described for panel B. Individual HRB (red) and vRNP (green) staining profiles, as well as merged images, are shown for each condition. siRNA treatments are shown to the left, and time points and stains are indicated at the top of each panel.

Similar articles

Cited by

References

    1. Akarsu H., et al. 2003. Crystal structure of the M1 protein-binding domain of the influenza A virus nuclear export protein (NEP/NS2). EMBO J. 22:4646–4655 - PMC - PubMed
    1. Amorim M. J., et al. 2011. A Rab11- and microtubule-dependent mechanism for cytoplasmic transport of influenza A virus vRNA. J. Virol. 85:4143–4156 - PMC - PubMed
    1. Bogerd H. P., Fridell R. A., Madore S., Cullen B. R. 1995. Identification of a novel cellular cofactor for the Rev/Rex class of retroviral regulatory proteins. Cell 82:485–494 - PubMed
    1. Bowzard J. B., Cheng D., Peng J., Kahn R. A. 2007. ELMOD2 is an Arl2 GTPase-activating protein that also acts on Arfs. J. Biol. Chem. 282:17568–17580 - PubMed
    1. Bruce E. A., et al. 2009. Budding of filamentous and non-filamentous influenza A virus occurs via a VPS4- and VPS28-independent pathway. Virology 390:268–278 - PubMed

Publication types

MeSH terms

Substances