. 2011 Sep;85(18):9568-77.
doi: 10.1128/JVI.00468-11. Epub 2011 Jul 13.

Epigenetic and transcriptional changes which follow Epstein-Barr virus infection of germinal center B cells and their relevance to the pathogenesis of Hodgkin's lymphoma

Affiliations

Epigenetic and transcriptional changes which follow Epstein-Barr virus infection of germinal center B cells and their relevance to the pathogenesis of Hodgkin's lymphoma

Sarah Leonard et al. J Virol. 2011 Sep.

Abstract

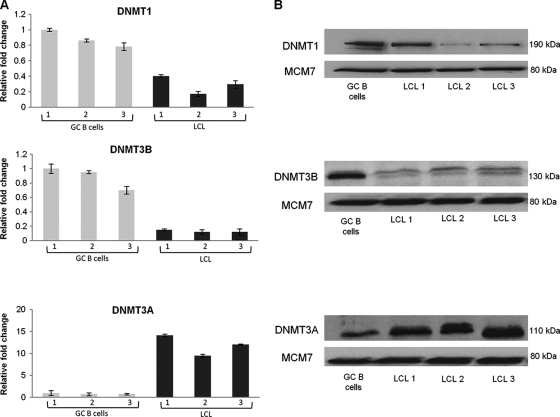
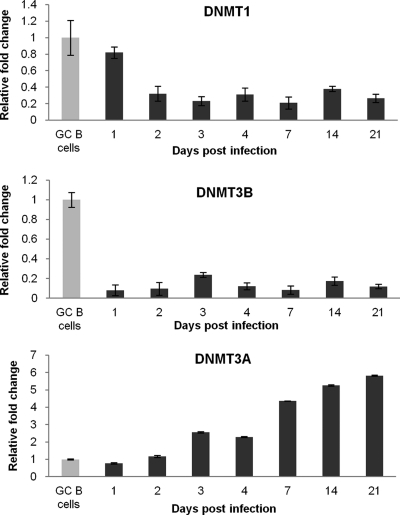
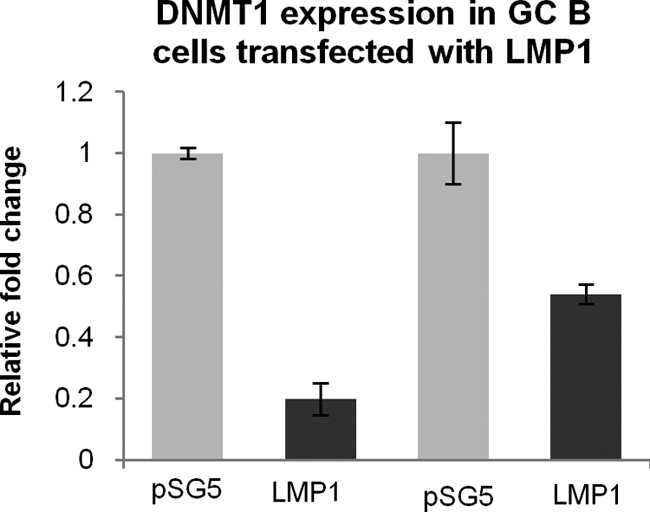
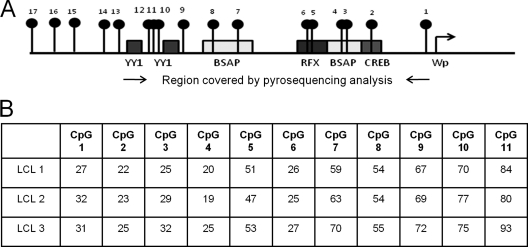
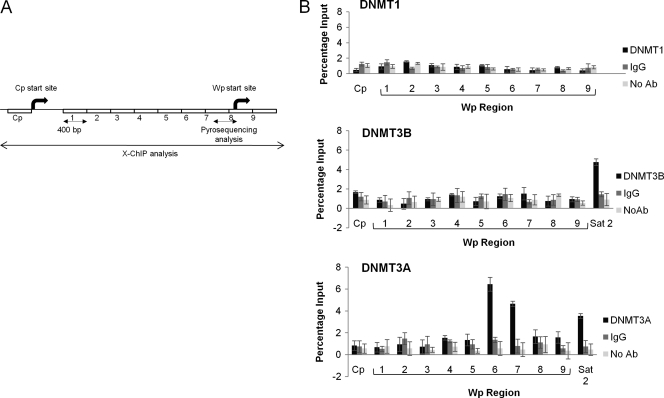
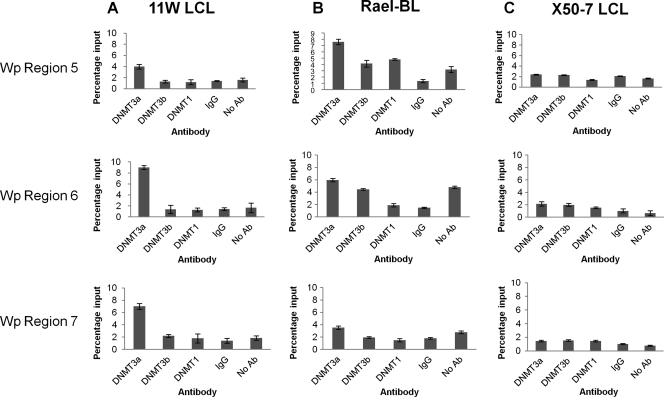
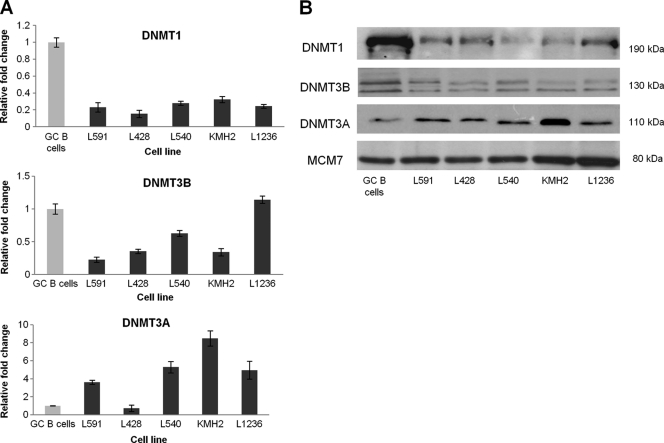
Although Epstein-Barr virus (EBV) usually establishes an asymptomatic lifelong infection, it is also implicated in the development of germinal center (GC) B-cell-derived malignancies, including Hodgkin's lymphoma (HL). Following primary infection, EBV remains latent in the memory B-cell population, where host-driven methylation of viral DNA contributes to the repression of viral gene expression. However, it is still unclear how EBV harnesses the cell's methylation machinery in B cells, how this contributes to viral persistence, and what impact this has on the methylation of cellular genes. We show that EBV infection of GC B cells is followed by upregulation of the DNA methyltransferase DNMT3A and downregulation of DNMT3B and DNMT1. We show that the EBV latent membrane protein 1 (LMP1) oncogene downregulates DNMT1 and that DNMT3A binds to the viral promoter Wp. Genome-wide promoter arrays performed with these cells showed that EBV-associated methylation changes in cellular genes were not randomly distributed across the genome but clustered at chromosomal locations, consistent with an instructive pattern of methylation, and were in part determined by promoter CpG content. Both DNMT3B and DNMT1 were downregulated and DNMT3A was upregulated in HL cell lines, recapitulating the pattern of expression observed following EBV infection of GC B cells. We also found, by using gene expression profiling, that genes differentially expressed following EBV infection of GC B cells were significantly enriched for those reported to be differentially expressed in HL. These observations suggest that EBV-infected GC B cells are a useful model for studying virus-associated changes contributing to the pathogenesis of HL.


Figures

Fig. 1.
Fig. 1.
DNMT1, DNMT3B, and DNMT3A expression in GC B cells and EBV-infected GC B cells. (A) Quantitative reverse transcriptase PCR (qRT-PCR) showing DNMT expression in LCL relative to uninfected GC B cells. Gray bars represent expression in GC B cells isolated from three different patients (1, 2, 3), and black bars represent expression in each of the corresponding EBV-infected GC B cells. The GC B cells with the highest expression of the gene in question served as the reference sample. Assays were carried out in triplicate, and results are presented as 2−ΔΔCT values. (B) Western blots showing DNMT expression in GC B cells and in corresponding EBV-infected GC B cells; MCM7 was used as a loading control.
Fig. 2.
Fig. 2.
Kinetics of DNMT1, DNMT3B, and DNMT3A expression in LCL derived from GC B cells. qRT-PCR showing changes in DNMT expression in LCL compared to that in GC B cells. Assays were carried out in triplicate, and results are presented as 2−ΔΔCT values. Experiments were performed with the three LCL, and representative results for one LCL are shown.
Fig. 3.
Fig. 3.
LMP1 downregulates DNMT1 in GC B cells. qRT-PCR showing downregulation of LMP1 following transfection of GC B cells with LMP1. Assays were performed in triplicate, and the results are presented as 2−ΔΔCT values compared to the vector control, pSG5.
Fig. 4.
Fig. 4.
Methylation status of Wp in three GC B-cell-derived LCL. (A) Schematic showing the region of Wp analyzed by pyrosequencing. Black lollipops represent CpG sites, and boxes denote transcription factor binding sites. (B) Percentage methylation at CpG sites in each LCL.
Fig. 5.
Fig. 5.
Binding of DNMT3A to Wp. (A) Schematic showing regions of Wp analyzed by X-ChIP. Numbers 1 to 9 represent locations of X-ChIP primers. (B) DNMT1, DNMT3B, or DNMT3A binding to nine regions of the Wp and Cp promoters was measured using X-ChIP. Cp provided a negative control, and Sat2, which has previously been shown to bind DNMT3A and DNMT3B (12), provided a positive control. Nonspecific binding was controlled for by including IgG and no-antibody reactions. Each assay was carried out in duplicate, and results are shown as a percentage of input. Experiments were performed with three GC B-cell-derived LCL, and representative results for one are shown.
Fig. 6.
Fig. 6.
Binding of DNMT1, DNMT3B, and DNMT3A to Wp in 11W LCL, Rael-BL, and X50-7 cell lines. (A) qPCR results showing binding of DNMT3A to regions 5, 6, and 7 of Wp in 11W LCL. (B) Binding of DNMT3A to region 5 in Rael-BL. (C) The absence of DNMT binding in X50-7. Although all regions of Wp were examined, only results for regions 5, 6, and 7 are reported, as the remaining regions showed no evidence of binding (data not shown). Nonspecific binding was controlled for by including IgG and no-antibody reactions. Each assay was carried out in duplicate, and results are shown as a percentage of input. Experiments were performed at least twice, and representative results for one are shown.
Fig. 7.
Fig. 7.
DNMT1, DNMT3B, and DNMT3A expression in five HL cell lines. (A) qRT-PCR showing DNMT expression in HL cell lines (black) compared with that of GC B cells (gray). Assays were performed in triplicate, and results are presented as 2−ΔΔCT values. (B) Western blot showing DNMT expression in HL cell lines compared to that in GC B cells. MCM7 was used as a loading control.
Fig. 8.
Fig. 8.
UHRF1 and GADD45A expression in GC B cells infected with EBV and in HL cell lines. qRT-PCR showing UHRF1 and GADD45A expression in GC B cells infected with EBV (dark gray) and HL cell lines (black) compared to that in GC B cells (light gray). Assays were performed in triplicate, and results are presented as 2−ΔΔCT values.

References

    1. Amara K., et al. 2010. DNA methyltransferase DNMT3b protein overexpression as a prognostic factor in patients with diffuse large B-cell lymphomas. Cancer Sci. 101:1722–1730 - PMC - PubMed
    1. Arora P., Kim E. O., Jung J. K., Jang K. L. 2008. Hepatitis C virus core protein downregulates E-cadherin expression via activation of DNA methyltransferase 1 and 3b. Cancer Lett. 261:244–252 - PubMed
    1. Barreto G., et al. 2007. Gadd45a promotes epigenetic gene activation by repair-mediated DNA demethylation. Nature 445:671–675 - PubMed
    1. Bell A. I., et al. 2006. Analysis of Epstein-Barr virus latent gene expression in endemic Burkitt's lymphoma and nasopharyngeal carcinoma tumour cells by using quantitative real-time PCR assays. J. Gen. Virol. 87:2885–2890 - PubMed
    1. Brune V., et al. 2008. Origin and pathogenesis of nodular lymphocyte-predominant Hodgkin lymphoma as revealed by global gene expression analysis. J. Exp. Med. 205:2251–2268 - PMC - PubMed

Publication types

MeSH terms

Substances