. 2011 Jul 13;31(28):10270-82.
doi: 10.1523/JNEUROSCI.5956-10.2011.

Coding of stereoscopic depth information in visual areas V3 and V3A

Affiliations

Coding of stereoscopic depth information in visual areas V3 and V3A

Akiyuki Anzai et al. J Neurosci. .

Abstract

The process of stereoscopic depth perception is thought to begin with the analysis of absolute binocular disparity, the difference in position of corresponding features in the left and right eye images with respect to the points of fixation. Our sensitivity to depth, however, is greater when depth judgments are based on relative disparity, the difference between two absolute disparities, compared to when they are based on absolute disparity. Therefore, the visual system is thought to compute relative disparities for fine depth discrimination. Functional magnetic resonance imaging studies in humans and monkeys have suggested that visual areas V3 and V3A may be specialized for stereoscopic depth processing based on relative disparities. In this study, we measured absolute and relative disparity-tuning of neurons in V3 and V3A of alert fixating monkeys, and we compared their basic tuning properties with those published previously for other visual areas. We found that neurons in V3 and V3A predominantly encode absolute, not relative, disparities. We also found that basic parameters of disparity-tuning in V3 and V3A are similar to those from other extrastriate visual areas. Finally, by comparing single-unit activity with multi-unit activity measured at the same recording site, we demonstrate that neurons with similar disparity selectivity are clustered in both V3 and V3A. We conclude that areas V3 and V3A are not particularly specialized for processing stereoscopic depth information compared to other early visual areas, at least with respect to the tuning properties that we have examined.


Figures
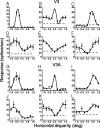
Figure 1.
Figure 1.
Horizontal disparity-tuning curves for six example neurons from area V3 (AF) and six neurons fromV3A (GL). In each case, disparity of the center patch was varied while the surround disparity remained 0 (fixation plane). Solid lines are the Gabor functions that best fit the data. Horizontal dashed lines indicate spontaneous activity levels. Each error bar indicates the SEM. deg, Degrees (°).
Figure 2.
Figure 2.
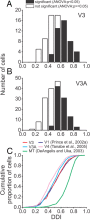
Population distributions of the disparity discrimination index. A, DDI distribution for V3 neurons. Black bars indicate neurons with significant disparity-tuning (ANOVA, p < 0.05). B, DDI distribution for V3A neurons; format as in A. C, Cumulative distributions of DDIs for V3 (red) and V3A (cyan) neurons, together with corresponding data for V1 (blue), V4 (pink), and MT (green) neurons. The V1, V4, and MT data are replotted from Prince et al. (2002b), Tanabe et al. (2005), and DeAngelis and Uka (2003), respectively.
Figure 3.
Figure 3.
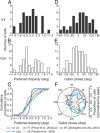
Population distributions of preferred disparity (AC) and Gabor phase (DF). A, The distribution of preferred disparities for V3 neurons. B, The distribution of preferred disparities for V3A neurons. C, Cumulative distributions of preferred disparities for V3 (red) and V3A (cyan) neurons and corresponding data for V1 (blue), V4 (pink), and MT (green) neurons, which are replotted from Prince et al. (2002b), Tanabe et al. (2005), and DeAngelis and Uka (2003), respectively. Dashed lines indicate distributions for neurons with eccentricities <10°. D, The distribution of Gabor phase for V3 neurons. E, The distribution of Gabor phase for V3A neurons. F, Distributions of Gabor phase for V3 and V3A neurons, together with data for V1, V4, and MT neurons that are replotted from the previous studies cited above except for V1 data, which are from Prince et al. (2002a). Color conventions as in C. deg, Degrees (°).
Figure 4.
Figure 4.
Disparity frequency as a function of eccentricity for V3 (red diamonds) and V3A (cyan circles) neurons. For comparison, data for V1 (blue triangles) and MT (green squares) neurons are replotted from Prince et al. (2002a) and DeAngelis and Uka (2003), respectively.
Figure 5.
Figure 5.
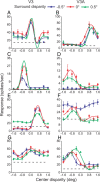
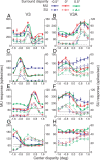
Examples of disparity tuning as a function of surround disparity (−0.5°, 0°, and 0.5° shown in blue, red, and green, respectively) from V3 neurons (A, C, E, and G) and V3A neurons (G, D, F, and H). Solid lines indicate Gabor functions that best fit the data. Horizontal dashed lines indicate spontaneous activity levels. Each error bar indicates the SEM. A, The tuned-zero V3 neuron shown in Figure 1B. B, The tuned-far V3A neuron of Figure 1I. C, The tuned-near V3 neuron from Figure 1A, which shows amplitude changes with surround disparity. D, A V3A neuron showing flattening of tuning for the near surround disparity. E, The tuned-far V3 neuron of Figure 1C, showing changes in baseline response. F, A tuned-near V3A neuron showing flattening of tuning at an elevated baseline. G, A V3 neuron with some degree of tuning shift with surround disparity. H, A V3A neuron with some degree of peak shifting. deg, Degrees (°).
Figure 6.
Figure 6.
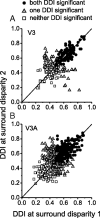
Comparison of DDI values for pairs of disparity-tuning curves measured at different surround disparities. Black circles, Cases where disparity-tuning is significant for both surround disparities; gray triangles, cases where tuning is significant for one of the two surround disparities; white squares, cases where neither surround disparity has significant tuning. A, Data from area V3. B, Data from V3A.
Figure 7.
Figure 7.
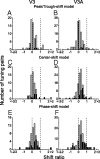
Distributions of shift ratios for neurons from V3 (A, C, E) and V3A (B, D, F). Filled bars indicate shift ratios that are significantly different from zero (bootstrap test, p < 0.05). A, B, Shift ratios from the peak/trough-shift model, which were computed based on peak/trough locations from independent Gabor fits to a pair of tuning curves measured at different surround disparities [V3: N = 64 (A); V3A: N = 127 (B)]. C, D, Shift ratios computed based on Gaussian center locations derived from fits of the center-shift model [V3: N = 54 (C); V3A: N = 108 (D)]. E, F, Shift ratios computed based on Gabor phase angles using the phase-shift model [V3: N = 52 (E); V3A: N = 111 (F)]. In all cases, the majority of shift ratios lie near 0.
Figure 8.
Figure 8.
Comparison of shift ratios across various cortical areas. Median shift ratios (based on the center-shift model or a slight variant; see Materials and Methods) for V1 (Cumming and Parker, 1999), V2 (Thomas et al., 2002), V3, V3A, V4 (Umeda et al., 2007), and MT (Uka and DeAngelis, 2006) are plotted (filled circles) along with the interquartile ranges (horizontal error bars). Dashed lines indicate shift ratios of 0 and 1, which correspond to coding of absolute and relative disparity, respectively.
Figure 9.
Figure 9.
Examples of MU (filled symbols) and SU (open symbols) tuning measured at −0.5° (blue), 0° (red), and 0.5° (green) surround disparities for four recording sites in V3 (A, C, E, G) and four additional sites in V3A (B, D, F, H). Solid and dashed curves are Gabor functions that best fit the MU and SU data, respectively. Solid and dashed horizontal lines indicate spontaneous activity levels for MU and SU responses, respectively. Each error bar indicates the SEM. deg, Degrees (°).
Figure 10.
Figure 10.
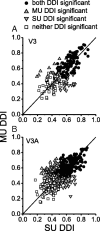
Comparison of DDI values for SU and MU responses from areas V3 (A) and V3A (B). Black circles, Both SU and MU tuning are significant; gray upward triangles, only MU disparity tuning is significant; gray downward triangles, only SU tuning is significant; white squares, neither SU nor MU tuning is significant. Solid lines indicate unity slope diagonals.
Figure 11.
Figure 11.
Comparisons of MU and SU disparity-tuning properties for surround disparities of −0.5° (squares), 0° (circles), and 0.5° (triangles) in V3 (A, C, E, and G) and V3A (B, D, F, and H). Solid lines indicate unity slope diagonals. Open symbols in A, E, and F are outliers described in the text. A, B, Preferred disparity (V3: N = 51; V3A: N = 150). Preferred disparities beyond the stimulus disparity range (13 and 11 data points for V3 and V3A, respectively) were excluded (see Materials and Methods). C, D, Gabor phase (V3: N = 64; V3A: N = 161). Since phase is a circular variable, it is bounded by the dashed lines. E, F, Disparity frequency (V3: N = 64; V3A: N = 161). G, H, Shift ratio based on the peak/trough-shift model (V3: N = 23; V3A: N = 78). In H, three outliers beyond the range of the axes are not shown. deg, Degrees (°).

References

    1. Adams DL, Zeki S. Functional organization of macaque V3 for stereoscopic depth. J Neurophysiol. 2001;86:2195–2203. - PubMed
    1. Anzai A, DeAngelis GC. Neural computations underlying depth perception. Curr Opin Neurobiol. 2010;20:367–375. - PMC - PubMed
    1. Backus BT, Fleet DJ, Parker AJ, Heeger DJ. Human cortical activity correlates with stereoscopic depth perception. J Neurophysiol. 2001;86:2054–2068. - PubMed
    1. Bonhoeffer T, Grinvald A. Iso-orientation domains in cat visual cortex are arranged in pinwheel-like patterns. Nature. 1991;353:429–431. - PubMed
    1. Bredfeldt CE, Cumming BG. A simple account of cyclopean edge responses in macaque v2. J Neurosci. 2006;26:7581–7596. - PMC - PubMed

Publication types

LinkOut - more resources