Review
. 2011 Aug 1;214(Pt 15):2474-94.
doi: 10.1242/jeb.053801.

Animal escapology II: escape trajectory case studies

Affiliations
Review

Animal escapology II: escape trajectory case studies

Paolo Domenici et al. J Exp Biol. .

Abstract

Escape trajectories (ETs; measured as the angle relative to the direction of the threat) have been studied in many taxa using a variety of methodologies and definitions. Here, we provide a review of methodological issues followed by a survey of ET studies across animal taxa, including insects, crustaceans, molluscs, lizards, fish, amphibians, birds and mammals. Variability in ETs is examined in terms of ecological significance and morpho-physiological constraints. The survey shows that certain escape strategies (single ETs and highly variable ETs within a limited angular sector) are found in most taxa reviewed here, suggesting that at least some of these ET distributions are the result of convergent evolution. High variability in ETs is found to be associated with multiple preferred trajectories in species from all taxa, and is suggested to provide unpredictability in the escape response. Random ETs are relatively rare and may be related to constraints in the manoeuvrability of the prey. Similarly, reports of the effect of refuges in the immediate environment are relatively uncommon, and mainly confined to lizards and mammals. This may be related to the fact that work on ETs carried out in laboratory settings has rarely provided shelters. Although there are a relatively large number of examples in the literature that suggest trends in the distribution of ETs, our understanding of animal escape strategies would benefit from a standardization of the analytical approach in the study of ETs, using circular statistics and related tests, in addition to the generation of large data sets.


Figures

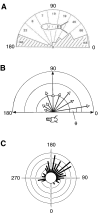
Fig. 1.
Fig. 1.
(A) Cartesian representation of the relationship between response angle (y-axis) and stimulus angle (x-axis). By convention, stimuli from and responses to the right are plotted as positive values whereas stimuli from and responses to the left are plotted as negative values [cockroach Periplaneta americana, data set 5i; N=431; unpublished figure based on data from Domenici et al. (Domenici et al., 2008)]. Inset: circular representation of the data using the convention shown in B. Responses are plotted as if the stimulus is always coming from the right of the animal. Concentric circles represent a frequency of 10. Bin frequency is 5 [reprinted from Current Biology, fig. 2A from Domenici et al. (Domenici et al., 2008) with permission from Elsevier]. (B) Definitions of escape trajectory angles in towards (left panel) and away (central panel) responses. Towards and away responses are escapes in which the turn angle achieved during the initial rotation is directed towards or away from the stimulus, respectively. In this example from the cockroach, the arc labelled ‘wind’ is the stimulus angle, the arc labelled ‘turn’ is the turn angle and the thick arc is the final escape trajectory (ET0). Away and towards responses may have the same ET0 (shown in the right panel) [based on fig. 5 from Booth et al. (Booth et al., 2009) reproduced with permission of the Journal of Neuroscience]. (C) The resultant ET0s may span 360 deg. In this example of escaping fish, all four 90 deg sectors can be reached by both away (left panels) and towards (right panels) responses [fig. 1 from Domenici (Domenici, 2002a) reproduced with permission from John Wiley & Sons Ltd Publisher]. Stimuli from the right and from the left are pooled as if from the right. In all circular plots in A, B and C, the threat is positioned at 0 deg.
Fig. 2.
Fig. 2.
Different conventions used in the literature for analysing escape trajectories in prey with various stimulus and response angles. The corresponding values of ET0, ET′ and ET″ are indicated on each plot. In all plots, the threat is positioned at 0 deg. ET0: the angle of the escape trajectory as illustrated in Fig. 1B; it corresponds to taking the angle in the semi-circle 0–180 or 180–360 deg based on whether the threat remains on the side of the original stimulation or ends up on the opposite side of it, respectively. (By convention, ETs are plotted as if the stimulus is always coming from the right.) ET′: the escape angle is calculated regardless of whether the prey is stimulated on the left or right side. Trajectories <180 deg are directed to the right of the predator's attack line whereas trajectories >180 deg are directed to the predator's left. ET″: the escape angle spans 0–180 deg only, as it is calculated as the angle between 0 deg and the direction of escape, regardless of the initial orientation of the prey.
Fig. 3.
Fig. 3.
Escape trajectories in cockroaches, crickets and locusts. Stimulus direction corresponds to 0 deg. (A) ET0s in the cockroach Periplaneta americana stimulated by wind (N=86) [reprinted from Current Biology, fig. 2B from Domenici et al. (Domenici et al., 2008) with permission from Elsevier]. Frequency distributions are shown by bars. Bin intervals are 5 deg; concentric circles represent a frequency of 2. Best-fit distributions at 90, 120, 150 and 180 deg are shown as multimodal curves. Arrowheads indicate peaks, defined as those that contribute at least 5% to the best-fit curve. (B) ET0s in the cricket Gryllus bimaculatus startled using wind stimulation [Nd=46, No=46; bin intervals are 10 deg; concentric circles represent a frequency of 1.6; data transformed from xy plot in fig. 4A in Tauber and Camhi (Tauber and Camhi, 1995)]. (C) ET0s in G. bimaculatus startled using wind stimulation [Nd=93, No=93; bin intervals are 10 deg; concentric circles represent a frequency of 2.5; data transformed from xy plot in fig. 3 in Kanou et al. (Kanou et al., 1999)]. (D) ET0s in the cave cricket Troglophilus neglectus startled using wind stimulation [Nd=95; bin intervals are 10 deg; concentric circles represent a frequency of 3.2; data transformed from xy plot in fig. 1 in Schrader (Schrader, 2000)]. (E) ET0s in the cricket Gryllodes sigillatus startled using wind stimulation [Nd=68; bin intervals are 10 deg; concentric circles represent a frequency of 2; data transformed from xy plot in fig. 2C in Kanou et al. (Kanou et al., 2006)]. (F) ET0s in the locust Locusta migratoria startled using a looming stimulus [Nd=60, No=70; bin intervals are 10 deg; concentric circles represent a frequency of 2; data transformed from xy plot in fig. 1B in Santer et al. (Santer et al., 2005)].
Fig. 4.
Fig. 4.
Escape angles relative to the body axis (head pointing at 0 deg, tail at 180 deg) in mechanically stimulated (A) Heteromurus nitidus (Collembola) [N=500; reprinted from Zoologische Jahrbuch, fig. 19 from Von Christian (Von Christian, 1978) with permission from Elsevier] and (B) Culex pipiens pupae [concentric circles represent N of 15, 25 and 35; fig. 1B reproduced with permission from Brackenbury (Brackenbury, 1999)]. (C) ET0s (in this case measured as the displacement of the centre of mass) relative to a looming visual stimulus in Drosophila melanogaster [Nd=89, No=91; data transformed from xy plot in fig. 1E in Card and Dickinson (Card and Dickinson, 2008)]. Following the convention for ET0 measurement adopted for the reanalysis of previously published data in this review, data are replotted as if stimulus is coming from the right – the original data of Card and Dickinson were plotted as if the stimulus is always coming from the left. Bin intervals are 10 deg; concentric circles represent a frequency of 2.5. In C, the threat is positioned at 0 deg.
Fig. 5.
Fig. 5.
ETs resulting from crustacean tail flips. (A) Tail flip escape responses in the lobster Nephrops norvegicus. Top and centre: superimposed outlines of sequential body positions seen from the side, showing flexion movement and the relative displacement of the centre of mass indicated by the dot, in escapes triggered by stimuli touching the rostrum (backward flip, top panel) and the telson (upward flip, centre panel). Bottom: trajectories of the centre of mass observed in different animals stimulated at the rostrum (unmarked) and the telson (T), relative to the ground (horizontal line) [fig. 4 reproduced with kind permission from Springer Science+Business Media, fig. 4A,B,D from Newland and Neil (Newland and Neil, 1990a)]. (B) Superimposed escape motions in the horizontal plane of Crangon crangon attacked by cod from the anterior right (top) and posterior right (bottom) quadrants [fig. 4 reproduced with permission from Arnott et al. (Arnott et al., 1999)]. (C) Circular frequency plots of ET0s of C. crangon attacked by cod, indicated by the stimulus direction (arrow at 0 deg). Two discernible ET0 peaks are seen at 130 and 180 deg. Top: all responses (N=76); bottom: away response only [N=47; bin intervals are 10 deg; concentric circles represent a relative frequency of 5%; fig. 6 reproduced with permission from Arnott et al. (Arnott et al., 1999)]. (D) Top left panel shows the exclusion envelope – the angular range spanning 63 deg either side of the direction of the approaching predator (arrow) that was never used by the escaping prey (black shaded area) – and the escape envelope – the unfilled sectors 75–156 deg to the left and right of the prey. The stippled regions in front and behind the body were never used by the shrimp. The other five panels show the interaction between the exclusion and the escape envelopes for different attack directions (the predator's attack line is indicated by the white arrow), leaving one or two empty sectors within which ET0s were observed [fig. 8 reproduced with permission from Arnott et al. (Arnott et al., 1999)].
Fig. 6.
Fig. 6.
(A) ETs in the crab Chasmagnathus granulatus triggered by a looming visual stimulus (black square). Upper left panel, stimulus from above; upper right panel, frontal stimulus; lower left panel, stimulus from the left; lower right panel, stimulus from the right [fig. 6A reproduced with permission from Oliva et al. (Oliva et al., 2007)]. (B) xy plot of stimulus versus response angle in visually stimulated escape responses of the crab Mictyris longicarpus. The variance is smaller when calculated around a mean escape angle of 56.8 deg than when calculated relative to the 45 deg negative slope representing escape directed 180 deg away from the stimulus [Nd=31, No=31; fig. 2 reproduced with permission from Nalbach (Nalbach, 1990)]. Inset: circular frequency distribution based on reanalysis of the xy plot shown in B. Peaks of ET0s can be seen at 150 and 210 deg. Bin intervals are 10 deg; concentric circles represent a frequency of 2; the threatening stimulus is positioned at 0 deg. (C) ET′s caused by a human approaching the blue crab Callinectes sapidus. The 30 deg angular sector of the human approach is indicated by the darkened arc. The seaward heading is indicated by 180 deg. The resultant escape trajectory is a compromise between escaping away from the threat and towards the refuge of deeper water. In the directly conflicting situation (lower panel), a seaward direction of escape is chosen [reprinted from Animal Behaviour, fig. 5 from Woodbury (Woodbury, 1986) with permission from Elsevier]. Open circles represent single events.
Fig. 7.
Fig. 7.
(A) The relationship between displacement from the stimulus versus net displacement in four species of copepod: (i) Tortanus discaudatus, (ii) Centropages hamatus, (iii) Acartia hudsonica and (iv) Temora longicornis. The line at 45 deg represents the maximum distance from the stimulus, i.e. escaping with an ET of 180 deg. Escape responses elicited by a water current tend to be directed at 180 deg, i.e. they are mainly aligned with the 45 deg line (open symbols), whereas those elicited by a vibrating stimulus (filled symbols) show high variability [reprinted with permission from Limnology and Oceanography, fig. 8 from Burdick et al. (Burdick et al., 2007); © 2007 by the American Society of Limnology and Oceanography, Inc.]. (B) ET′s in the vertical plane in the copepod Acartia tonsa. Top panel, adult males; bottom panel, adult females. Relative frequencies (%) divided into 20 deg bins are plotted. 0, 90 and 270 deg correspond to stimulus direction, upward-directed escapes and downward-directed escapes, respectively; concentric circles represent a frequency of 2 [reproduced with kind permission from Marine Ecology Progress Series, fig. 6 from Buskey et al. (Buskey et al., 2002)].
Fig. 8.
Fig. 8.
ETs in fish. In all circular plots, the threatening stimulus is positioned at 0 deg. (A–D) ETs in herring Clupea harengus. (A) Away response in single fish (N=75). Bin intervals are 10 deg; concentric circles represent a frequency of 4. (B) Towards response in single fish (N=42). Bin intervals are 10 deg; concentric circles represent a frequency of 2. (C) Away responses in schooling fish (N=223; bin intervals are 10 deg; concentric circles represent a frequency of 10). (D) Towards responses in schooling fish (N=30; bin intervals are 10 deg; concentric circles represent a frequency of 2) [reproduced with kind permission from Springer Science+Business Media, fig. 3 from Domenici and Batty (Domenici and Batty, 1997)]. (E) ETs (away responses only) in the angelfish Pterophyllum eimekei (N=46; bin intervals are 10 deg; concentric circles represent a frequency of 2) [fig. 6B reproduced with permission from Domenici and Blake (Domenici and Blake, 1993)]. (F) ETs in the goldfish Carassius auratus (only away responses unobstructed by walls) [Nd=28; No=28; bin intervals are 10 deg; concentric circles represent a frequency of 2; data are based on an xy plot from fig. 6B of Eaton and Emberley (Eaton and Emberley, 1991)]. (G) ET″s in the guppy Poecilia reticulata [N=55; data were originally divided into 20 deg bins; concentric circles represent a frequency of 2.5; based on table 4A from Walker et al. (Walker et al., 2005)]. (H) ETs in bichir Polyptersus senegalensis [N=65; bin intervals are 10 deg; concentric circles represent a frequency of 2; fig. 6B reproduced with permission from Tytell and Lauder (Tytell and Lauder, 2002)]. (I) ET′s in roach, Rutilus rutilus [N=71; 0 deg corresponds to escaping directly away from the stimulus; bin intervals are 10 deg; fig. 3 reproduced with permission from Karlsen et al. (Karlsen et al., 2004)]. (J) Diagram illustrating the angle of ET″s (calculated relative to the attack path of the predator, see main text) in herring C. harengus larvae attacked by cod Gadus morhua for the data shown in K [reprinted from Animal Behaviour, fig. 2 from Fuiman (Fuiman, 1993) with permission from Elsevier]. (K) ET″s in herring larvae (N=59). Left panel: attacks; right panel: false alarm (defined as responses to predator motion by individuals that were not in immediate danger). Both small larvae (filled bars) and large larvae (open bars) are shown. Bin intervals are 20 deg [reprinted from Animal Behaviour, fig. 5C,D from Fuiman (Fuiman, 1993) with permission from Elsevier]. (L,M) ET″s in cod larvae (L, horizontal angles; M, vertical angles), with 0 deg representing a response away from the threat. Responses from fed (filled bars) and unfed (striped bars) larvae are shown. Bin intervals are 20 deg [reprinted from the Journal of Experimental Marine Biology and Ecology, fig. 4A,D from Skaaja and Browman (Skaaja and Browman, 2007) with permission from Elsevier].
Fig. 9.
Fig. 9.
Escape responses and prey capture in frogs (Rana pipiens). (A) xy plots (response turn angle versus stimulus angle) of escape responses (N=564) and (B) prey capture behaviour (N=184) [reproduced with kind permission from Springer Science+Business Media, fig. 8 from King and Comer (King and Comer, 1996)]. Note the low variability in the relation between x and y in B compared with A. (C) ET0s in away responses (Nd=391), (D) ET0s in towards responses (Nd=118), (E) ET0s in away responses from left stimuli (Nd=191), (F) ET0s in away responses from right stimuli (Nd=200). For plots C–F, bin intervals are 10 deg and concentric circles represent a frequency of 5 in all plots except C (frequency is 10). Plots C–F are based on data shown in A. In all circular plots, the threat is positioned at 0 deg. (G) Relative frequency distributions of turn angles in away (red line) and towards responses (black line). Most towards responses are small turns (<50 deg), except for occasional ‘overshooting turns’ (sensu Domenici et al., 2009; indicated by the arrow – these are responses that start out as towards responses, move through a position facing head on to the threat, and end up as away responses), which appear as turns ranging from 100 to 150 deg.
Fig. 10.
Fig. 10.
Escape responses in lizards. (A) ET0s in Psammodromus algirus (N=60). Bin intervals are 20 deg; concentric circles represent a frequency of 5; the threatening stimulus is at 0 deg. ET0s are different from a von Mises distribution, shown as the curve in B [fig. 1 from Martin and Lopes (Martin and Lopes, 1996) © 1996 by the American Psychological Association; reproduced with permission]. (C) ET′s relative to a refuge (cliff, at 0 deg) of the 70 side-blotched lizard (Uta stansburiana), showing non-random ET′s toward the refuge [fig. 3A from Zani et al. (Zani et al., 2009) © 2008 NRC Canada or its licensors; reproduced with permission]. (D) ET′s in Uma scoparia (N=28). Left: ET′s relative to the approaching threat, whose position is indicated by the filled circle on the bottom. Centre: the same ET′s measured relative to the nearest vegetation cover (position indicated by the filled circle at the top). Right: the same ET′s measured relative to the steepest uphill path indicated by the filled circled at the top. Only the distribution of ET′s in the left plot shows a significant difference from a random distribution. Small filled circles represent single events [reprinted from Animal Behaviour, fig. 3 from Jayne and Ellis (Jayne and Ellis, 1998), with permission from Elsevier].
Fig. 11.
Fig. 11.
Escape trajectories in birds, in the vertical plane. (A) The angle of attack of the predator determines the angle of ascent of the prey in blue tits (Parus caeruleus, Pc) and great tits (Parus major, Pm). Both species escape by taking off in a direction away from the predator, make a half-loop and attempt to escape by flying above the predator in a direction opposite to the predator's approach. Prey tend to ascend more steeply (black lines) when attacked at lower angles than when attacked at high angles (red lines) [reproduced with kind permission from Springer Science+Business Media, fig. 1 from Lind et al. (Lind et al., 2002)]. (B) The effect of cover on the angle of ascent at 20, 30, 40 and 50 cm along the escape flight of great tits. Birds tend to take off at steeper angles in the absence of cover [reproduced with kind permission from Springer Science+Business Media, fig. 2 from Kullberg and Lafrenz (Kullberg and Lafrenz, 2007)].
Fig. 12.
Fig. 12.
(A) Escape variables in black-tailed deer (Odocoileus hemionus columbianus). Flight initiation distance (reaction distance) is the distance between the approaching threat and the deer at the onset of the escape response. Escape angle (ET″) is the angle between the line of flight initiation distance and the line of distance moved (between deer origin and deer stops) [reproduced with permission from Oxford University Press, fig. 1 from Stankowich and Coss (Stankowich and Coss, 2007)]. (B) The relationship between flight initiation distance and escape angle in deer [reproduced with permission from Oxford University Press, fig. 2 from Stankowich and Coss (Stankowich and Coss, 2007)]. (C) Reanalysis of the data shown in B as a semi-circular plot of ET″s (No=82, Nd=79; bin intervals are 10 deg; concentric semi-circles represent a frequency of 2.5; threatening stimulus at 0 deg). (D) Escape responses in gerbils (Meriones unguiculatus) attacked by a moving stimulus [reproduced with kind permission from Springer Science+Business Media, fig. 4A–C from Ellard and Goodale (Ellard and Goodale, 1988)]. The positions of the stimulus are represented by the descending series of numbered three-sided boxes. The stimulus moves from top to bottom. The successive positions of the body axis of the gerbil are represented by the numbered segments, where the snout is represented by the dot at the end of each segment. Numbers correspond to video frames shot at 60 Hz. Left: the gerbil makes an escape response in a direction away from a peripherally presented stimulus. Centre: the gerbil makes an escape response in a direction towards the trajectory of a centrally presented stimulus. Right: when escape responses are elicited in the presence of a refuge, gerbils escape towards the entrance of that refuge (grey rectangle).

References

    1. Ansell A. D., Cattaneo-Vietti R., Chiantore M. (1998). Swimming in the Antarctic scallop Adamussium colbecki: analysis of in situ video recordings. Antarct. Sci. 10, 369-375
    1. Arnott S. A., Neil D. M., Ansell A. D. (1999). Escape trajectories of the brown shrimp Crangon crangon, and a theoretical consideration of initial escape angles from predators. J. Exp. Biol. 202, 193-209 - PubMed
    1. Azizi E., Landberg T. (2002). Effects of metamorphosis on the aquatic escape response of the two-lined salamander (Eurycea bislineata). J. Exp. Biol. 205, 841-849 - PubMed
    1. Bailey D. M., Johnston I. A. (2005). Scallop swimming kinematics and muscle performance: modelling the effects of “within-animal” variation in temperature sensitivity. Mar. Freshw. Behav. Physiol. 38, 1-19
    1. Batschelet E. (1981). Circular Statistics in Biology. New York: Academic Press;

Publication types