

Consumption of added sugars is decreasing in the United States
- PMID: 21753067
- PMCID: PMC3155936
- DOI: 10.3945/ajcn.111.018366
Consumption of added sugars is decreasing in the United States
Abstract
Background: The consumption of added sugars (caloric sweeteners) has been linked to obesity, diabetes, and heart disease. Little is known about recent consumption trends in the United States or how intakes compare with current guidelines.
Objective: We examined trends in intakes of added sugars in the United States over the past decade.
Design: A cross-sectional study of US residents ≥2 y of age (n = 42,316) was conducted by using dietary data from NHANES 1999-2008 (five 2-y cycles) and data for added-sugar contents from the MyPyramid Equivalents Database. Mean intakes of added sugars (grams and percentage of total energy intake) were weighted to obtain national estimates over time across age, sex, and race-ethnic groups. Linear trends were tested by using Wald's F tests.
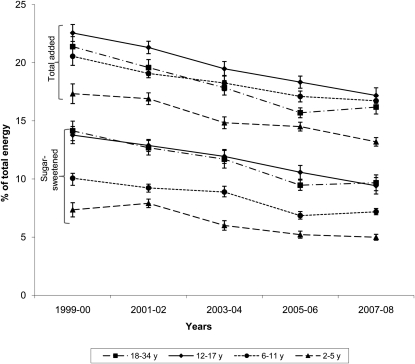
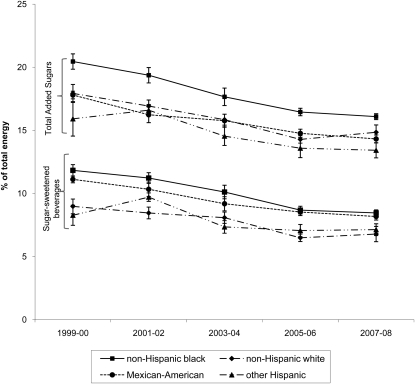
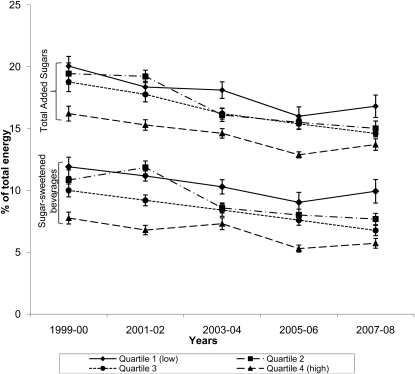
Results: Between 1999-2000 and 2007-2008, the absolute intake of added sugars decreased from a mean (95% CI) of 100.1 g/d (92.8, 107.3 g/d) to 76.7 g/d (71.6, 81.9 g/d); two-thirds of this decrease, from 37.4 g/d (32.6, 42.1 g/d) to 22.8 g/d (18.4, 27.3 g/d), resulted from decreased soda consumption (P-linear trend <0.001 for both). Energy drinks were the only source of added sugars to increase over the study period (P-linear trend = 0.003), although the peak consumption reached only 0.15 g/d (0.08, 0.22 g/d). The percentage of total energy from added sugars also decreased from 18.1% (16.9%, 19.3%) to 14.6% (13.7%, 15.5%) (P-linear trend <0.001).
Conclusion: Although the consumption of added sugars in the United States decreased between 1999-2000 and 2007-2008, primarily because of a reduction in soda consumption, mean intakes continue to exceed recommended limits.
Figures
Comment in
-
Intake of added sugars in the United States: what is the measure?Am J Clin Nutr. 2011 Dec;94(6):1652-3. doi: 10.3945/ajcn.111.025858. Am J Clin Nutr. 2011. PMID: 22106419 No abstract available.
References
-
- Popkin BM, Nielsen SJ. The sweetening of the world's diet. Obes Res 2003;11:1325–32 - PubMed
-
- Block G. Foods contributing to energy intake in the US: data from NHANES III and NHANES 1999-2000. J Food Compost Anal 2004;17:439–47
-
- Johnson RK, Frary C. Choose beverages and foods to moderate your intake of sugars: the 2000 dietary guidelines for Americans–what's all the fuss about? J Nutr 2001;131:2766S–71S - PubMed
-
- Marshall TA, Eichenberger Gilmore JM, Broffitt B, Stumbo PJ, Levy SM. Diet quality in young children is influenced by beverage consumption. J Am Coll Nutr 2005;24:65–75 - PubMed
Publication types
MeSH terms
Substances
Grants and funding
LinkOut - more resources
Full Text Sources
Medical
Miscellaneous
