

A photo-multiplier tube-based hybrid MRI and frequency domain fluorescence tomography system for small animal imaging
- PMID: 21753235
- PMCID: PMC3961472
- DOI: 10.1088/0031-9155/56/15/007
A photo-multiplier tube-based hybrid MRI and frequency domain fluorescence tomography system for small animal imaging
Abstract
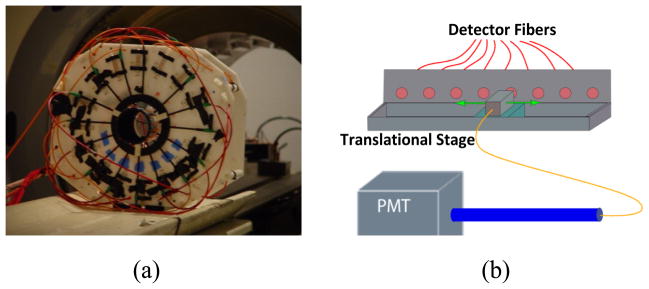
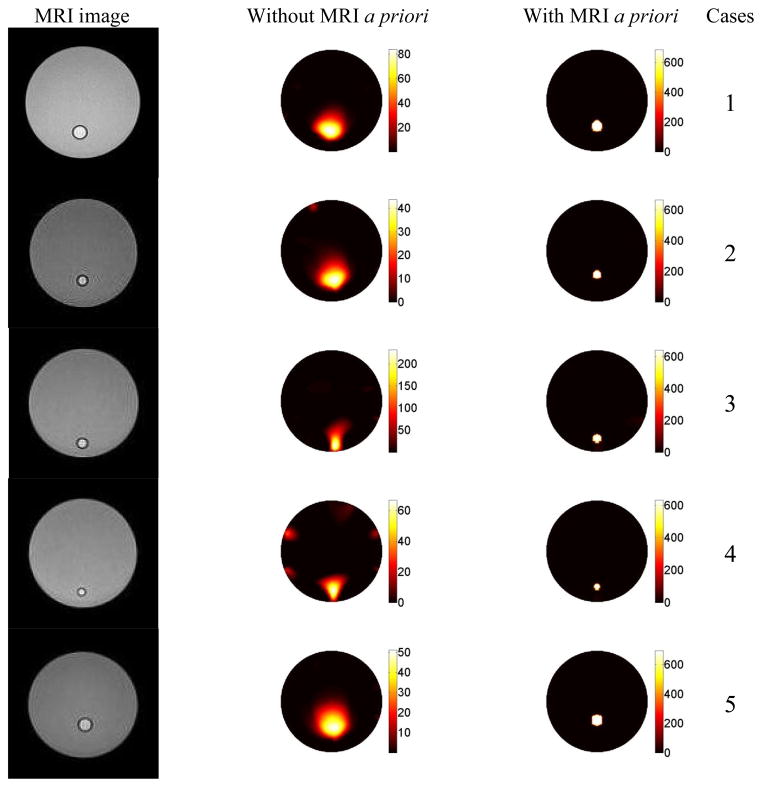
Fluorescence tomography (FT) is a promising molecular imaging technique that can spatially resolve both fluorophore concentration and lifetime parameters. However, recovered fluorophore parameters highly depend on the size and depth of the object due to the ill-posedness of the FT inverse problem. Structural a priori information from another high spatial resolution imaging modality has been demonstrated to significantly improve FT reconstruction accuracy. In this study, we have constructed a combined magnetic resonance imaging (MRI) and FT system for small animal imaging. A photo-multiplier tube is used as the detector to acquire frequency domain FT measurements. This is the first MR-compatible time-resolved FT system that can reconstruct both fluorescence concentration and lifetime maps simultaneously. The performance of the hybrid system is evaluated with phantom studies. Two different fluorophores, indocyanine green and 3-3' diethylthiatricarbocyanine iodide, which have similar excitation and emission spectra but different lifetimes, are utilized. The fluorescence concentration and lifetime maps are both reconstructed with and without the structural a priori information obtained from MRI for comparison. We show that the hybrid system can accurately recover both fluorescence intensity and lifetime within 10% error for two 4.2 mm-diameter cylindrical objects embedded in a 38 mm-diameter cylindrical phantom when MRI structural a priori information is utilized.
Figures


Similar articles
-
Simulation-based evaluation of the resolution and quantitative accuracy of temperature-modulated fluorescence tomography.Appl Opt. 2015 Sep 1;54(25):7612-21. doi: 10.1364/AO.54.007612. Appl Opt. 2015. PMID: 26368884 Free PMC article.
-
Fluorescence diffuse optical tomography with functional and anatomical a priori information: feasibility study.Phys Med Biol. 2007 Sep 21;52(18):5569-85. doi: 10.1088/0031-9155/52/18/007. Epub 2007 Sep 3. Phys Med Biol. 2007. PMID: 17804882
-
Combined fluorescence and X-Ray tomography for quantitative in vivo detection of fluorophore.Technol Cancer Res Treat. 2010 Feb;9(1):45-52. doi: 10.1177/153303461000900105. Technol Cancer Res Treat. 2010. PMID: 20082529 Free PMC article.
-
Quantitative fluorescence tomography with functional and structural a priori information.Appl Opt. 2009 Mar 1;48(7):1328-36. doi: 10.1364/ao.48.001328. Appl Opt. 2009. PMID: 19252634 Free PMC article.
-
Quantitative fluorescence tomography using a combined tri-modality FT/DOT/XCT system.Opt Express. 2010 Apr 12;18(8):7835-50. doi: 10.1364/OE.18.007835. Opt Express. 2010. PMID: 20588625 Free PMC article.
Cited by
-
Dynamic dual-tracer MRI-guided fluorescence tomography to quantify receptor density in vivo.Proc Natl Acad Sci U S A. 2013 May 28;110(22):9025-30. doi: 10.1073/pnas.1213490110. Epub 2013 May 13. Proc Natl Acad Sci U S A. 2013. PMID: 23671066 Free PMC article.
-
Hybrid FMT-MRI applied to in vivo atherosclerosis imaging.Biomed Opt Express. 2014 Apr 28;5(5):1664-76. doi: 10.1364/BOE.5.001664. eCollection 2014 May 1. Biomed Opt Express. 2014. PMID: 24877023 Free PMC article.
-
A True Multi-modality Approach for High Resolution Optical Imaging: Photo-Magnetic Imaging.Proc SPIE Int Soc Opt Eng. 2014 Feb 19;8937:89370G. doi: 10.1117/12.2040870. Proc SPIE Int Soc Opt Eng. 2014. PMID: 25767691 Free PMC article.
-
Simulation-based evaluation of the resolution and quantitative accuracy of temperature-modulated fluorescence tomography.Appl Opt. 2015 Sep 1;54(25):7612-21. doi: 10.1364/AO.54.007612. Appl Opt. 2015. PMID: 26368884 Free PMC article.
-
Photo-magnetic imaging: resolving optical contrast at MRI resolution.Phys Med Biol. 2013 Jun 7;58(11):3551-62. doi: 10.1088/0031-9155/58/11/3551. Epub 2013 May 2. Phys Med Biol. 2013. PMID: 23640084 Free PMC article.
References
-
- Ale A, Schulz RB, Sarantopoulos A, Ntziachristos V. Imaging performance of a hybrid x-ray computed tomography-fluorescence molecular tomography system using priors. Medical Physics. 2010;37:1976–1986. - PubMed
-
- Arridge SR. Optical tomography in medical imaging. Inverse Problems. 1999;15:R41–R93.
-
- Bloch S, Lesage F, McIntosh L, Gandjbakhche A, Liang K, Achilefu S. Whole-body fluorescence lifetime imaging of a tumor-targeted near-infrared molecular probe in mice. Journal of Biomedical Optics. 2005;10:054003. - PubMed
-
- Bremer C. Optical methods. Handbook of Experimental Pharmacology. 2008;(185 Pt 2):3–12. - PubMed
-
- Bremer C, Bredow S, Mahmood U, Weissleder R, Tung CH. Optical imaging of matrix metalloproteinase-2 activity in tumors: feasibility study in a mouse model. Radiology. 2001;221:523–529. - PubMed
Publication types
MeSH terms
Grants and funding
LinkOut - more resources
Full Text Sources
Medical