

Microfluidic fluorescence in situ hybridization and flow cytometry (μFlowFISH)
- PMID: 21755095
- PMCID: PMC3145043
- DOI: 10.1039/c1lc20151d
Microfluidic fluorescence in situ hybridization and flow cytometry (μFlowFISH)
Abstract
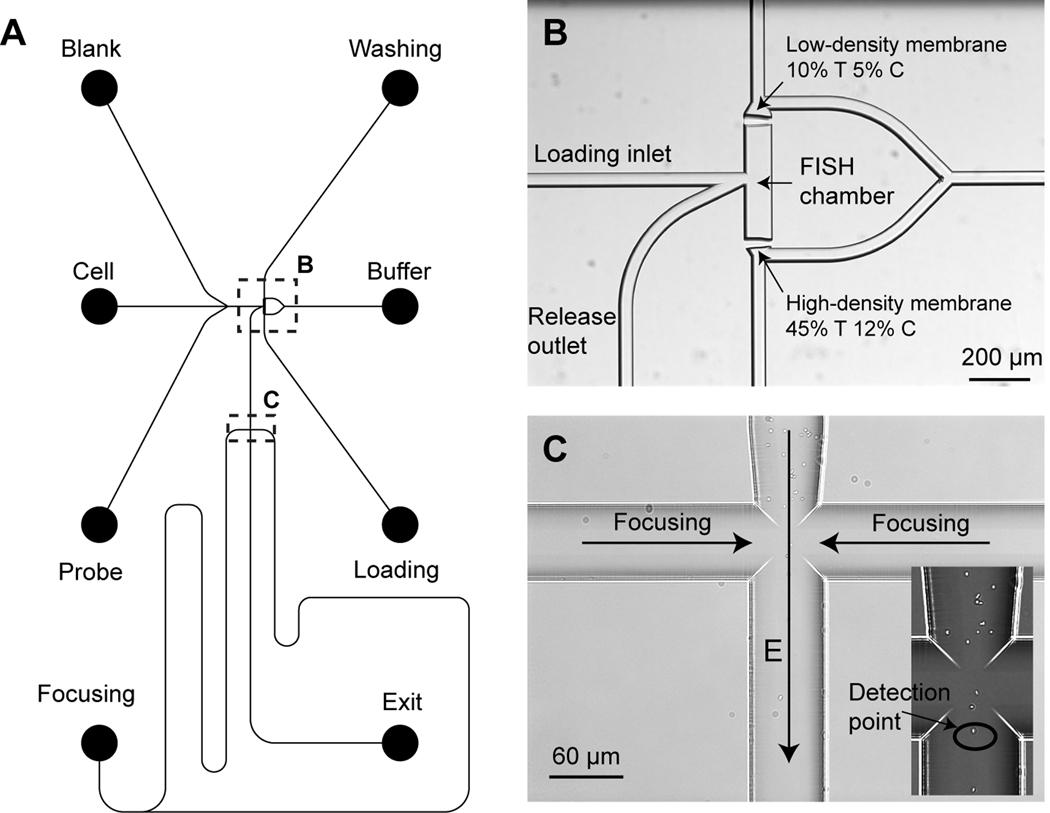
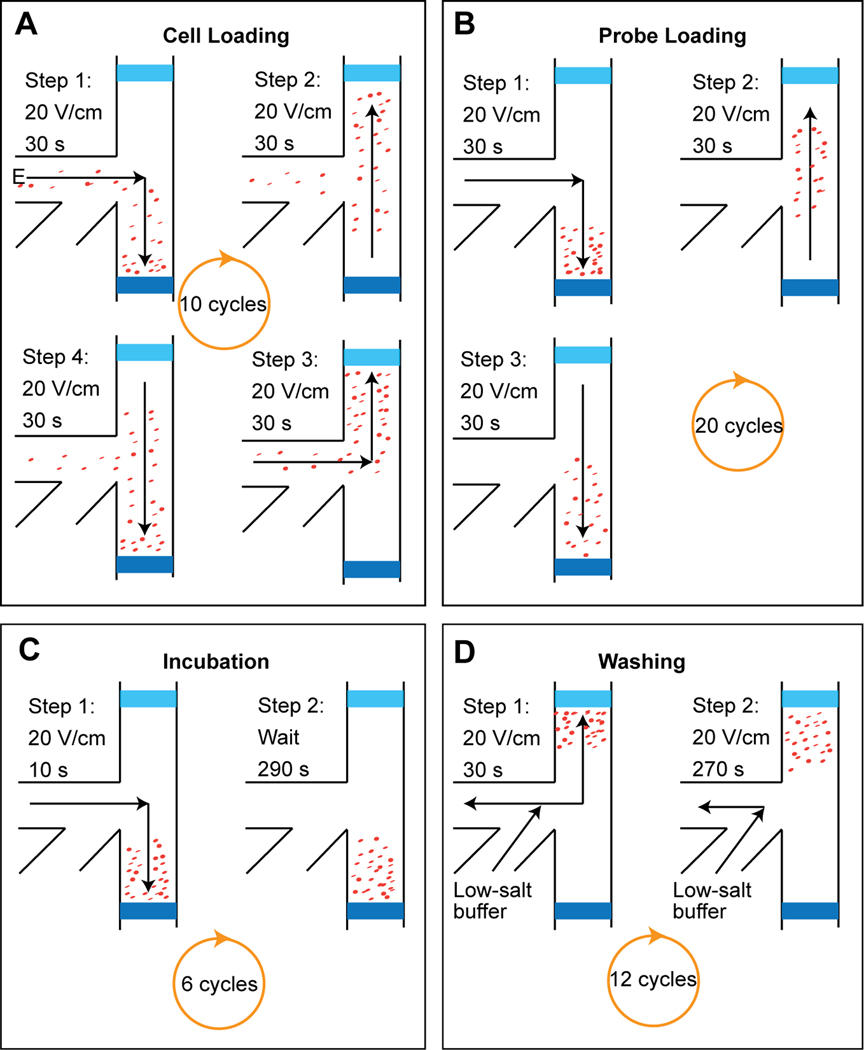
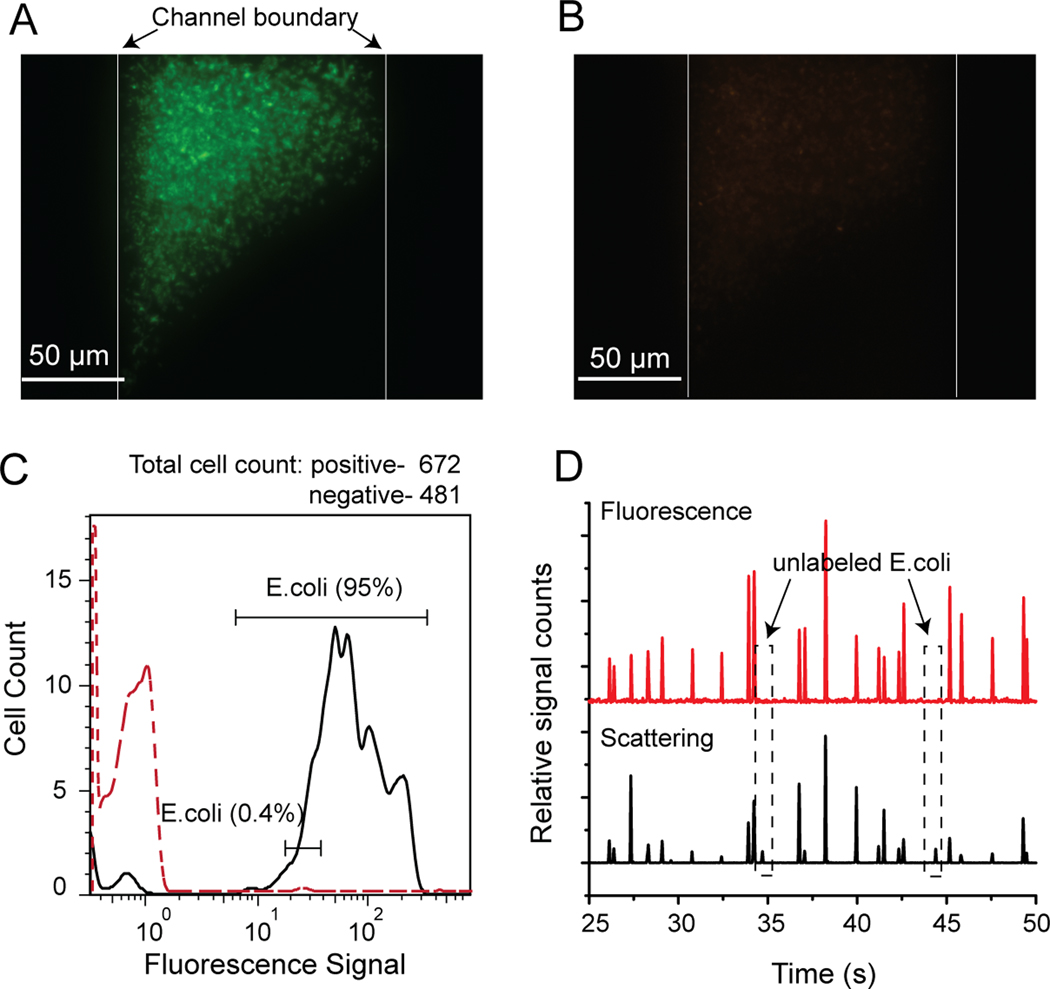
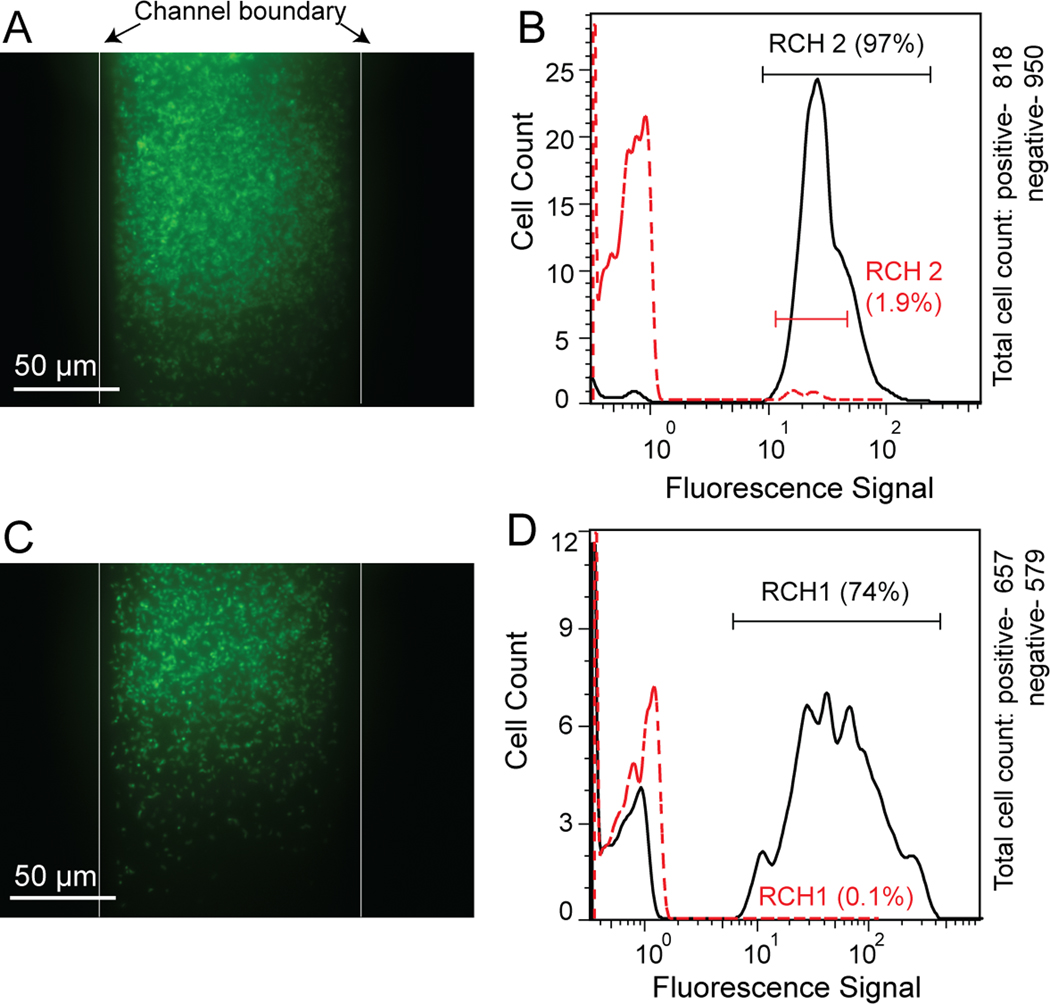
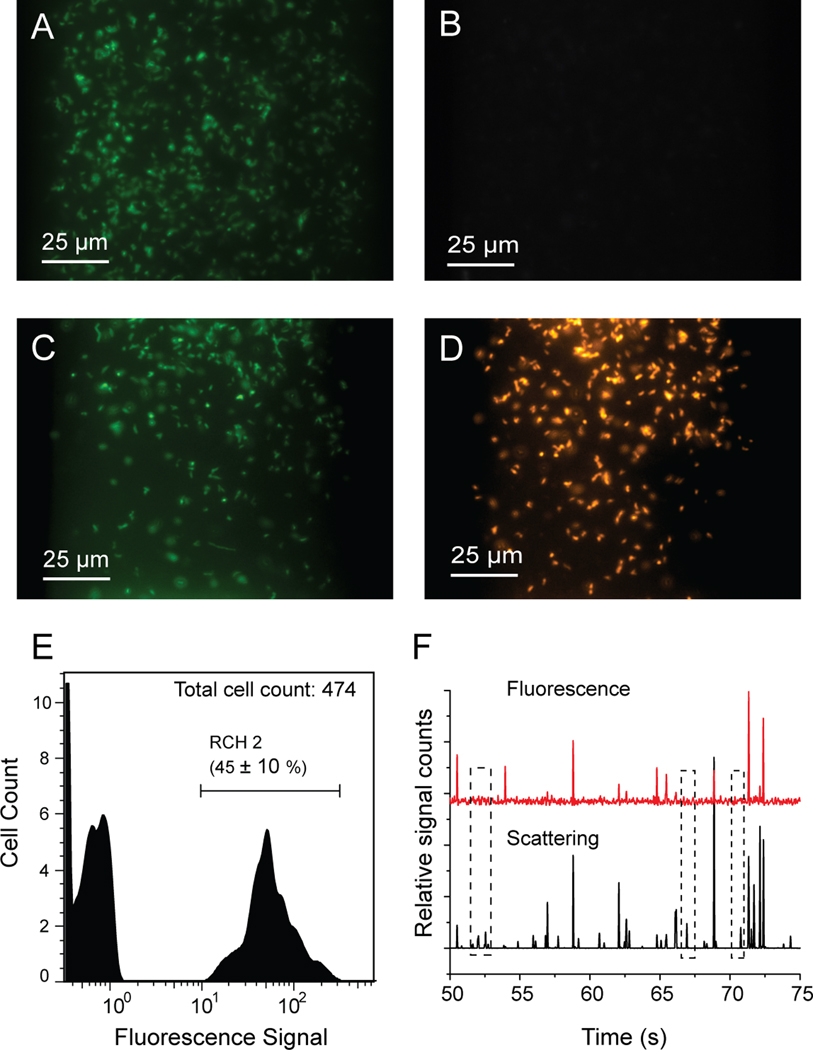
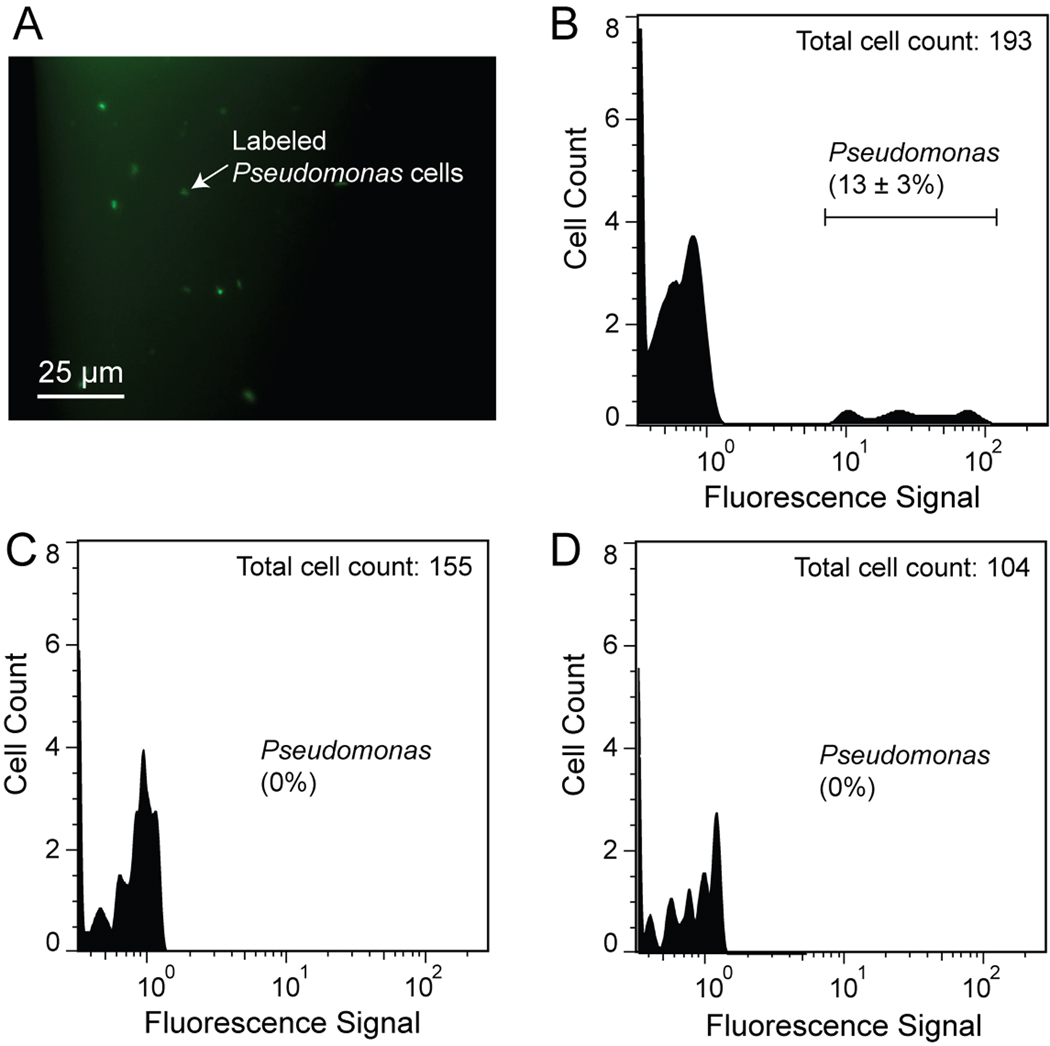
We describe an integrated microfluidic device (μFlowFISH) capable of performing 16S rRNA fluorescence in situ hybridization (FISH) followed by flow cytometric detection for identifying bacteria in natural microbial communities. The device was used for detection of species involved in bioremediation of Cr(vi) and other metals in groundwater samples from a highly-contaminated environmental site (Hanford, WA, USA). The μFlowFISH seamlessly integrates two components: a hybridization chamber formed between two photopolymerized membranes, where cells and probes are electrophoretically loaded, incubated and washed, and a downstream cross structure for electrokinetically focusing cells into a single-file flow for flow cytometry analysis. The device is capable of analyzing a wide variety of bacteria including aerobic, facultative and anaerobic bacteria and was initially tested and validated using cultured microbes, including Escherichia coli, as well as two strains isolated from Hanford site: Desulfovibrio vulgaris strain RCH1, and Pseudomonas sp.strain RCH2 that are involved in Cr(vi) reduction and immobilization. Combined labeling and detection efficiencies of 74-97% were observed in experiments with simple mixtures of cultured cells, confirming specific labeling. Results obtained were in excellent agreement with those obtained by conventional flow cytometry confirming the accuracy of μFlowFISH. Finally, the device was used for analyzing water samples collected on different dates from the Hanford site. We were able to monitor the numbers of Pseudomonas sp. with only 100-200 cells loaded into the microchip. The μFlowFISH approach provides an automated platform for quantitative detection of microbial cells from complex samples, and is ideally suited for analysis of precious samples with low cell numbers such as those found at extreme environmental niches, bioremediation sites, and the human microbiome.
This journal is © The Royal Society of Chemistry 2011
Figures
Similar articles
-
Simple detection of small amounts of Pseudomonas cells in milk by using a microfluidic device.Lett Appl Microbiol. 2006 Dec;43(6):631-6. doi: 10.1111/j.1472-765X.2006.02013.x. Lett Appl Microbiol. 2006. PMID: 17083709
-
Experimental improvements in combining CARD-FISH and flow cytometry for bacterial cell quantification.J Microbiol Methods. 2011 Dec;87(3):309-15. doi: 10.1016/j.mimet.2011.09.003. Epub 2011 Sep 22. J Microbiol Methods. 2011. PMID: 21963488
-
Quantification of uncultured Ruminococcus obeum-like bacteria in human fecal samples by fluorescent in situ hybridization and flow cytometry using 16S rRNA-targeted probes.Appl Environ Microbiol. 2002 Sep;68(9):4225-32. doi: 10.1128/AEM.68.9.4225-4232.2002. Appl Environ Microbiol. 2002. PMID: 12200269 Free PMC article.
-
Fluorescence in situ hybridization (FISH) for direct visualization of microorganisms.J Microbiol Methods. 2000 Jul;41(2):85-112. doi: 10.1016/s0167-7012(00)00152-4. J Microbiol Methods. 2000. PMID: 10991623 Review.
-
Microdevice in Cellular Pathology: Microfluidic Platforms for Fluorescence in situ Hybridization and Analysis of Circulating Tumor Cells.Anal Sci. 2015;31(9):867-73. doi: 10.2116/analsci.31.867. Anal Sci. 2015. PMID: 26353951 Review.
Cited by
-
Single-cell measurements of IgE-mediated FcεRI signaling using an integrated microfluidic platform.PLoS One. 2013;8(3):e60159. doi: 10.1371/journal.pone.0060159. Epub 2013 Mar 27. PLoS One. 2013. PMID: 23544131 Free PMC article.
-
FISH Variants.Methods Mol Biol. 2021;2246:17-33. doi: 10.1007/978-1-0716-1115-9_2. Methods Mol Biol. 2021. PMID: 33576980 Review.
-
FISH and chips: a review of microfluidic platforms for FISH analysis.Med Microbiol Immunol. 2020 Jun;209(3):373-391. doi: 10.1007/s00430-019-00654-1. Epub 2020 Jan 21. Med Microbiol Immunol. 2020. PMID: 31965296 Free PMC article. Review.
-
Complete genome sequence of Pseudomonas stutzeri strain RCH2 isolated from a Hexavalent Chromium [Cr(VI)] contaminated site.Stand Genomic Sci. 2017 Feb 8;12:23. doi: 10.1186/s40793-017-0233-7. eCollection 2017. Stand Genomic Sci. 2017. PMID: 28194258 Free PMC article.
-
Individually addressable arrays of replica microbial cultures enabled by splitting SlipChips.Integr Biol (Camb). 2014 Aug;6(8):796-805. doi: 10.1039/c4ib00109e. Integr Biol (Camb). 2014. PMID: 24953827 Free PMC article.
References
-
- Savage DC. Annual Review of Microbiology. 1977;31:107–133. - PubMed
-
- Hazen TC, Dubinsky EA, DeSantis TZ, Andersen GL, Piceno YM, Singh N, Jansson JK, Probst A, Borglin SE, Fortney JL, Stringfellow WT, Bill M, Conrad ME, Tom LM, Chavarria KL, Alusi TR, Lamendella R, Joyner DC, Spier C, Baelum J, Auer M, Zemla ML, Chakraborty R, Sonnenthal EL, D'Haeseleer P, Holman HYN, Osman S, Lu ZM, Van Nostrand JD, Deng Y, Zhou JZ, Mason OU. Science. 2010;330:204–208. - PubMed
-
- Han R, Geller JT, Yang L, Brodie EL, Chakraborty R, Larsen JT, Beller HR. Environmental Science & Technology. 2010;44:7491–7497. - PubMed
-
- Gadd GM. Microbiology-Sgm. 2010;156:609–643. - PubMed
Publication types
MeSH terms
Substances
Grants and funding
LinkOut - more resources
Full Text Sources
Other Literature Sources
Miscellaneous