Review
. 2012 Jan-Feb;31(1):134-78.
doi: 10.1002/mas.20342. Epub 2011 Jul 13.

Multi-dimensional mass spectrometry-based shotgun lipidomics and novel strategies for lipidomic analyses

Affiliations
Review

Multi-dimensional mass spectrometry-based shotgun lipidomics and novel strategies for lipidomic analyses

Xianlin Han et al. Mass Spectrom Rev. 2012 Jan-Feb.

Abstract

Since our last comprehensive review on multi-dimensional mass spectrometry-based shotgun lipidomics (Mass Spectrom. Rev. 24 (2005), 367), many new developments in the field of lipidomics have occurred. These developments include new strategies and refinements for shotgun lipidomic approaches that use direct infusion, including novel fragmentation strategies, identification of multiple new informative dimensions for mass spectrometric interrogation, and the development of new bioinformatic approaches for enhanced identification and quantitation of the individual molecular constituents that comprise each cell's lipidome. Concurrently, advances in liquid chromatography-based platforms and novel strategies for quantitative matrix-assisted laser desorption/ionization mass spectrometry for lipidomic analyses have been developed. Through the synergistic use of this repertoire of new mass spectrometric approaches, the power and scope of lipidomics has been greatly expanded to accelerate progress toward the comprehensive understanding of the pleiotropic roles of lipids in biological systems.


Figures

FIGURE 1
FIGURE 1
Yearly histogram of lipidomics obtained by SciFinder Scholar with “lipidomics” as a keyword.
FIGURE 2
FIGURE 2
Tandem mass spectrometric modes for analyses of lipids. CID stands for collision-induced dissociation when an inert gas is present in the collision cell. The letter “a” in neutral-loss scan mode denotes the mass of the neutral-loss fragment.
FIGURE 3
FIGURE 3
Schematic illustration of the inter-relationship among the MS/MS techniques for the analysis of individual molecular species of a class of interest. We only illustrate the analysis of three species (M1, M2, and M3) of a class for simplicity, whereas there exist up to hundreds of individual molecular species within a class. We assume that this class of lipid species, similar to a class of phospholipids or sphingolipids possesses one common neutral-loss fragment with mass of ma (i.e., M1 − m1a = M2 − m2a = M3 − m3a = ma (a constant)), one common fragment ion at m/z mc (i.e., m1c = m2c = m3c = mc), and a specific ion to individual species at m/z m1b, m2b, and m3b, respectively, which might not be identical to each other. Specifically, the common neutral fragment and the common fragment ion both result from the head group of the class; the individual species-specific ions represent the fatty acyl moieties of the species; and thus the residual part of each individual species can be derived from these fragments in combination with the m/z of each molecule ion. Panel A shows a simplified full-mass scan; Panel B illustrates the product-ion analysis of these molecule ions; Panel C demonstrates the scanning of the individual neutral-loss fragment between a specific molecule ion and its individual fragment ion; and Panel D represents the scanning of each individual fragment ion. It should be emphasized that, although the analyses of fragments with either neutral-loss scanning (NLS) or precursor-ion scanning (PIS) are much more complicated than those in product-ion scanning in this simplified case, the analyses by NLS or PIS are much simpler than that with product-ion scanning in reality as discussed in the text.
FIGURE 4
FIGURE 4
Two-dimensional mass spectrometric mapping of a mixture of phospholipids in the product-ion mode. The mixture of phospholipids is comprised of two or three species of an individual anionic phospholipid class with a total of four classes, including di14:0 phosphatidic acid (PA) (m/z 591.4), 16:0–18:1 PA (m/z 673.5), di18:2 PA (m/z 695.5), di15:0 phosphatidylglycerol (PG) (m/z 693.5), 16:0–18:1 PG (m/z 747.5), di22:6 PG (m/z 865.5), 16:0–18:1 phosphatidylinositol (PI) (m/z 835.5), 18:0–20:4 PI (m/z 885.5), di14:0 phosphatidylserine (PS) (m/z 678.4), 17:0-14:1 PS (m/z 718.5), and 16:0–18:1 PS (m/z 760.5) in the different mass levels. For comparison to the 2D mappings with other tandem mass spectrometric techniques (see Figs. 5 and 6), product-ion analyses were conducted with a mass resolution of 0.7 Th unit by unit from m/z 550 to m/z 950. Each product-ion mass spectrum was acquired at a scan rate of 0.5 s between m/z 50 and m/z 950 for 1 min in the profile mode. Absolute ion counts in each mass spectrum were displayed after averaging the absolute ion counts of each individual data point.
FIGURE 5
FIGURE 5
Two-dimensional mass spectrometric mapping of a mixture of phospholipids in the neutral-loss scanning mode. The mixture of phospholipids is identical to that used for acquisition of mass spectra in Figure 4. 2D mapping with neutral-loss scans was conducted with mass resolution of 0.7 Th unit by unit from 50 to 950 amu. Each neutral-loss scan was acquired at a scan rate of 0.5 s between m/z 550 and m/z 950 for 1 min in the profile mode. The y-axis mass in the map was plotted after transforming the neutral-loss data by subtracting the neutral-loss mass from the molecule ion mass. Absolute ion counts in each mass spectrum were displayed after averaging the absolute ion counts of each individual data point.
FIGURE 6
FIGURE 6
Two-dimensional mass spectrometric map of a mixture of phospholipids in the precursor-ion scanning mode. The mixture of phospholipids is identical to that used for acquisition of mass spectra in Figure 4. Precursor-ion scan analyses were conducted with a mass resolution of 0.7 Th unit by unit from m/z 50 to m/z 950. Each precursor-ion mass spectrum was acquired at a scan rate of 0.5 s between m/z 550 and m/z 950 for 1 min in the profile mode. Absolute ion counts in each mass spectrum were displayed after averaging the absolute ion counts of each individual data point.
FIGURE 7
FIGURE 7
General structure of glycerol-based lipids with three building blocks. Three building blocks are linked to the hydroxy groups of a glycerol backbone. Potential candidates of the building blocks are listed.
FIGURE 8
FIGURE 8
General structure of sphingoid-based lipids with three building blocks. Building block I represents a different polar moiety (linked to the oxygen at the C1 position of sphingoid backbone). Building block II represents fatty acyl chains (acylated to the primary amine at the C2 position of sphingoid backbone) with or without the presence of a hydroxy group, which is usually located at the alpha or omega position. Building block III represents the aliphatic chains in all of possible sphingoid backbones, which are carbon-carbon linked to the C3 position of sphingoid backbones and vary with the aliphatic chain length, degree of unsaturation, the presence of branch, and the presence of an additional hydroxy group.
FIGURE 9
FIGURE 9
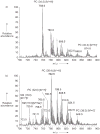
Positive-ion DESI mass spectra recorded from metastatic human-liver adenocarcinoma tissue. Methanol/water (1:1, v/v) with 0.1% NH4OH was sprayed. (a) Representative DESI mass spectrum from non-tumor region of the tissue. (b) Representative DESI mass spectrum from cancerous region of the tissue. (Reprinted from (Wiseman et al., 2005) with permission from Wiley – VHC, Copyright 2005).
FIGURE 10
FIGURE 10
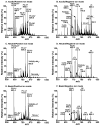
The effects of matrix on MALDI-TOF/MS analysis of lipids. MALDI mass spectra of di18:0 phosphatidylcholine (PtdCho) acquired on a 4800 MALDI-TOF/TOF Analyzer in the positive-ion mode with different matrices: A) 9-aminoacridine (10 mg/mL) dissolved in isopropanol/acetonitrile (60/40, v/v); B) CHCA (10 mg/mL) dissolved in methanol with 0.1% TFA; C) DHB (0.5 M) dissolved in methanol with 0.1% TFA; and D) THAP (40 mM) dissolved in methanol. The prefix ‘‘D’’ stands for diacyl species. (Reprinted from the supplemental materials of ref. (Sun et al., 2008) with permission from the American Chemical Society, Copyright 2008).
FIGURE 11
FIGURE 11
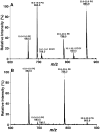
Mass spectral comparisons of phosphatidylcholine species present in mouse heart lipid extracts and sulfatide species present in mouse brain cortical lipid extracts acquired with either ESI or MALDI. Lipid extracts of murine myocardium (upper panel) or mouse brain cortex (lower panel) were examined with (A) and (C) ESI-MS or (B) and (D) MALDI-TOF/MS with 9-aminoacridine as the matrix (Sun et al., 2008; Cheng et al., 2010b). The prefix “D” stands for diacyl species. “IS” denotes internal standard.
FIGURE 12
FIGURE 12
Representative positive- and negative-ion ESI mass spectra acquired under weak acidic, neutral, and weak basic conditions. A lipid extract of mouse myocardium was prepared and mass spectrometric analysis was performed (Han, Yang, & Gross, 2008). Positive- and negative-ion ESI mass spectra as indicated were acquired after direct infusion in the presence of 10% acetic acid (Panels A and B), 5 mM ammonium acetate (Panels C and D), and 10 μM lithium hydroxide (Panels E and F) in the infused solution. IS and Ac stand for “internal standard” and “acetate”, respectively.
FIGURE 13
FIGURE 13
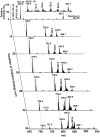
Two-dimensional electrospray ionization mass spectrometric analysis of choline glycerophospholipid species present in a mouse liver chloroform extract under different collision energy conditions. Two-dimensional MS analysis of neutral-loss scans (NLS) of 50.0 amu that corresponds to the loss of methyl chloride from the chloride adducts of phosphocholine-containing species) from a crude hepatic lipid extract was performed with a variation of collision energies. The 2D mass spectrum shows a few representative NLS acquired under the corresponding collision energies as indicated. The survey-scan mass spectrum acquired in the negative-ion mode directly from a diluted hepatic lipid extract is shown on the top. “IS” denotes internal standard. All mass spectral traces are displayed after normalization to the base peak in each individual spectrum.
FIGURE 14
FIGURE 14
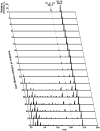
Two-dimensional mass spectrometric analysis of polyunsaturated fatty acid fragmentation pattern with variation of collision energy. Mass spectrometric analysis was performed with a TSQ Quantum Ultra Plus triple-quadrupole mass spectrometer (Thermo Fisher Scientific, San Jose, CA) equipped with an automated nanospray apparatus (i.e., Nanomate HD, Advion Bioscience Ltd., Ithaca, NY) and Xcalibur system software. The first and third quadrupoles were used as independent mass analyzers with a mass resolution setting of 0.7 Thomson, and the second quadrupole served as a collision cell for tandem mass spectrometry. Product-ion scan of 8,11,14-eicosatrienoic acid (20:3 FA) (5 pmol/μL) was performed after direct infusion in the negative-ion mode at a fixed collision gas pressure of 1 mTorr and varied collision energies from 2 to 36 eV at an interval of 2 eV as indicated. A 2-min period of signal averaging in the profile mode was used for each scan. All the scans were automatically acquired with a customized sequence subroutine operated under Xcalibur software. All the scans are displayed after being amplified to the 20% of the base peak in each individual scan.
FIGURE 15
FIGURE 15
Two-dimensional mass spectrometric analysis of polyunsaturated fatty acid fragmentation pattern with variation of collision gas pressure. Mass spectrometric analysis was performed with a TSQ Quantum Ultra Plus triple-quadrupole mass spectrometer (Thermo Fisher Scientific, San Jose, CA) equipped with an automated nanospray apparatus (i.e., Nanomate HD, Advion Bioscience Ltd., Ithaca, NY) and Xcalibur system software. The first and third quadrupoles were used as independent mass analyzers with a mass resolution setting of 0.7 Thomson while the second quadrupole served as a collision cell for tandem mass spectrometry. Product-ion scan of 8,11,14-eicosatrienoic acid (20:3 FA) (5 pmol/μL) was performed after direct infusion in the negative-ion mode at the fixed collision energy of 16 eV and varied collision gas pressures ranging from 0 to 3 mTorr as indicated. A 2-min period of signal averaging in the profile mode was employed for each scan. All the scans were automatically acquired with a customized sequence subroutine operated under Xcalibur software. All the scans are displayed after being amplified to the 5% of the base peak in each individual scan.
FIGURE 16
FIGURE 16
Schematic comparison of intrasource separation of lipid categories to the theoretical electrophoretic separation of lipid classes. Panel A schematically shows the selective ionization of different lipid categories under three different experimental conditions. Panel B schematically shows the imaginary chromatograms of lipid classes after electrophoretic analyses under corresponding experimental conditions. PC, TAG, FA, PE, and AL stand for phosphatidylcholine, triacylglyceride, free fatty acid, phosphatidylethanolamine, and anionic lipids, respectively. (Reprinted from (Christie & Han, 2010) with permission).
FIGURE 17
FIGURE 17
The dependence of ionization efficiency on the charge propensities of analytes. A phospholipid mixture was comprised of 1 pmol/μL each of di15:0 and di22:6 phosphatidylglycerol (PG) (i.e., anionic lipids), 10 pmol/μL each of di14:1 and di18:1 phosphatidylcholine (PC) (i.e., charge neutral lipids), and 15 pmol/μL each of di15:0 and di20:4 phosphatidylethanolamine (PE) (i.e., weakly anionic lipids) species in 1:1 (v/v) chloroform/methanol. The mixture was analyzed with a QqQ mass spectrometer (TSQ Quantum Ultra, Thermo Fisher Scientific) in the negative-ion mode after direct infusion in the absence (Panel A) or presence (Panel B) of 30 pmol/μL of LiOH in methanol. All the indicated molecular species were confirmed with product-ion ESI-MS analysis. The horizontal bars indicate the ion peak intensities after removal of 13C isotopes and normalization of the species to the one with less number of carbon atoms (i.e., the one with lower molecular weight) in each lipid class. (Modified from the ref. (Han et al., 2006b) with permission from the American Society for Mass Spectrometry, Copyright 2006).
FIGURE 18
FIGURE 18
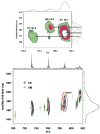
MALDI ion mobility two-dimension mass spectrum of a mixture comprised of brain phosphatidylcholine and sphingomyelin. MALDI ion mobility 2D spectrum of 25 pmol each of brain phosphatidylcholine (PC) extract and brain sphingomyelin (SM) extract was acquired with DHA matrix. The results demonstrate the ion mobility separation of PC and SM species. (Reprinted from the ref. (Jackson et al., 2008) with permission from the American Society for Mass Spectrometry, Copyright 2008).
FIGURE 19
FIGURE 19
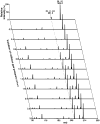
Representative two-dimensional mass spectrometric analyses of anionic phospholipids in a lipid extract of mouse cortex. The lipid extract was prepared with a modified Bligh and Dyer procedure and properly diluted prior to direct infusion into an ESI QqQ mass spectrometer (TSQ quantum ultra mass spectrometer, Thermo Fisher Scientific, San Jose, CA). The survey scan or MS/MS scans of the 2D ESI mass spectrum were acquired in the negative-ion mode with sequentially programmed customized scans with Xcalibur software. “PIS” denotes precursor-ion scanning, “NLS” stands for neutral-loss scan, and “IS” represents internal standard. All scans are displayed after normalization to the base peak in each individual scan.
FIGURE 20
FIGURE 20
Representative two-dimensional mass spectrometric analyses of ethanolamine glycerophospholipids in a lipid extract of mouse cortex after in situ fluorenylmethoxylcarbonyl (Fmoc) chloride derivatization in the negative-ion mode. A ESI mass spectrum of Fmoc-PE was acquired in the negative-ion mode directly from a diluted mouse cortex lipid extract after derivatization with Fmoc chloride (Han et al., 2005). Analyses of Fmoc-PE building blocks in the second dimension, including the Fmoc moiety and fatty acyl carboxylates with precursor-ion scanning (PIS) and neutral-loss scanning (NLS), were performed. “IS” denotes internal standard; m:n indicates an acyl chain with m carbons and n double bonds; FA stands for fatty acyl chain. Each of the broken lines indicates the crossing peaks (fragmental ions) of a deprotonated molecule ion with Fmoc-PE building blocks. All mass spectral scans were displayed after normalization to the base peak in each individual spectrum.
FIGURE 21
FIGURE 21
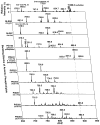
Two-dimensional mass spectrometric analyses of sphingolipid species after treatment of a mouse cortex lipid extract with lithium methoxide. Panel A shows the analyses of sphingolipids in the lipid extract of mouse cortex after treatment with lithium methoxide in the negative-ion mode. Building block analyses of the lipid extract after treatment with lithium methoxide were acquired with precursor-ion scanning (PIS) of m/z 97 (i.e., sulfate) for the analysis of sulfatide species and neutral-loss scanning (NLS) of 36 u (the loss of HCl from cerebroside (HexCer) chloride adducts) identifies the presence of 2-hydroxy HexCer, respectively. Panel B shows the analyses of sphingolipids in the lipid extract of mouse cortex after treatment with lithium methoxide in the positive-ion mode after addition of a small amount of LiOH. The mass trace “a” in Panel B is the survey scan of the lipid extract of mouse cortex after treatment with lithium methoxide. The mass trace “b” in Panel B identifies the presence of sphingomyelin (SM) species in the solution with NLS183.1, which corresponds to phosphocholine. The mass trace “c” in Panel B identifies the presence of HexCer species in the solution with NLS162.1, which corresponds to hexose. Analyses of this mass spectrum and the mass trace “c” in Panel A identify the individual HexCer species with or without a hydroxy moiety. IS denotes internal standard. Each spectrum displayed is normalized the base peak in the spectrum.
FIGURE 22
FIGURE 22
Representative mass spectrometric analysis of a mouse myocardial lipid extract with different amounts of spiked di14:1 phosphatidylcholine. Different amounts of di14:1 phosphatidylcholine (PC) (0.16 pmol/μl in Panel A, 0.8 pmol/μL in Panel B, 4 pmol/μL in Panel C, and 16 pmol/μL in Panel D) prior to the MS analysis were spiked into a fixed amount of a lipid extract of mouse myocardium (approximately 6 pmol/μL), which was prepared in the absence of di14:1 PC during lipid extraction. Full mass spectra were directly acquired after infusion of this diluted solution in the presence of a small amount of LiOH (20 pmol/μL). The ion at m/z 680.4, which corresponds to lithiated di14:1 PC, is specified.
FIGURE 23
FIGURE 23
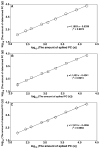
Linear correction of the amount of spiked di14:1 phosphatidylcholine with those determined with mass spectrometry. Samples spiked with 10 different amounts of di14:1 phosphatidylcholine (PC) into a lipid extract of mouse myocardium (see text) were prepared in duplicates. The amount of the spiked di14:1 PC in each prepared sample was determined with either full-MS analysis in triplicates (Panel A), NLS183.1 (Panel B), or NLS189.1 in comparison to the amount of an endogenous PC species (i.e., 16:0–22:6 PC at m/z 812.6 as a lithium adduct), which was pre-determined. Each data point represents mean ± SD from the analysis of either 6 full MS spectra, 2 NLS183.1 spectra, or 2 NLS189.1 spectra of each spiked amount of di14:1 PC. Most of the error bars of the data points are within the symbols.
FIGURE 24
FIGURE 24
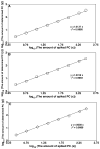
Linear correlation of the spiked amounts of 16:0–18:2 phosphatidylcholine with those determined with a ratiometric comparison to that of di14:1 phosphatidylcholine as an internal standard. In the experiments, a fixed amount of di14:1 phosphatidylcholine (PC) (15 nmol/mg protein) was used as an internal standard. The amounts of 16:0–18:2 PC species (one of the endogenous species present in mouse myocardial lipid extracts) were added in a factor of its endogenous mass content from 0, 1, 2, 4, 8, 16, 32, 64, to 100, where the endogenous content of 16:0–18:2 PC was pre-determined as 2.9 nmol/mg protein. Proper amounts of both PC species were added to each of the mouse myocardial homogenates prior to the lipid extraction. Each preparation of lipid extraction with added di14:1 PC and 16:0–18:2 PC was separately performed in triplicates. Each lipid extraction sample was analyzed with full-MS in triplicates, once with NLS183.1, and once with NLS189.1. These mass spectra were separately used to quantify the mass content of 16:0–18:2 PC with a ratiometric comparison to that of di14:1 PC. The determined mass content of 16:0–18:2 PC represents the mean ± SD from the triplicated sample preparation. Most of the error bars are within the symbols.

References

    1. Abe T, Norton WT. The characterization of sphingolipids from neurons and astroglia of immature rat brain. J Neurochem. 1974;23:1025–1036. - PubMed
    1. Al-Saad KA, Zabrouskov V, Siems WF, Knowles NR, Hannan RM, Hill HH., Jr Matrix-assisted laser desorption/ionization time-of-flight mass spectrometry of lipids: ionization and prompt fragmentation patterns. Rapid Commun Mass Spectrom. 2003;17:87–96. - PubMed
    1. Altelaar AF, Klinkert I, Jalink K, de Lange RP, Adan RA, Heeren RM, Piersma SR. Gold-enhanced biomolecular surface imaging of cells and tissue by SIMS and MALDI mass spectrometry. Anal Chem. 2006;78:734–742. - PubMed
    1. Andreyev AY, Fahy E, Guan Z, Kelly S, Li X, McDonald JG, Milne S, Myers D, Park H, Ryan A, Thompson BM, Wang E, Zhao Y, Brown HA, Merrill AH, Raetz CR, Russell DW, Subramaniam S, Dennis EA. Subcellular organelle lipidomics in TLR-4-activated macrophages. J Lipid Res. 2010;51:2785–2797. - PMC - PubMed
    1. Angelini R, Babudri F, Lobasso S, Corcelli A. MALDI-TOF/MS analysis of archaebacterial lipids in lyophilized membranes dry-mixed with 9-aminoacridine. J Lipid Res. 2010;51:2818–2825. - PMC - PubMed

Publication types

MeSH terms

LinkOut - more resources