. 2011 Aug 17;22(8):1491-502.
doi: 10.1021/bc100485f. Epub 2011 Jul 22.

Fluorescent DNA nanotags featuring covalently attached intercalating dyes: synthesis, antibody conjugation, and intracellular imaging

Affiliations

Fluorescent DNA nanotags featuring covalently attached intercalating dyes: synthesis, antibody conjugation, and intracellular imaging

Andrea L Stadler et al. Bioconjug Chem. .

Abstract

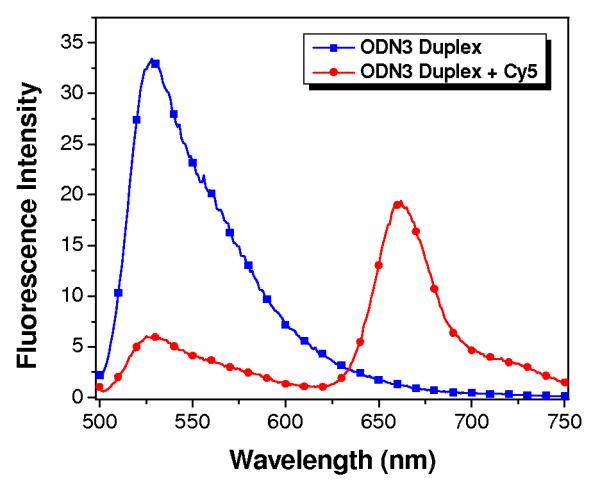
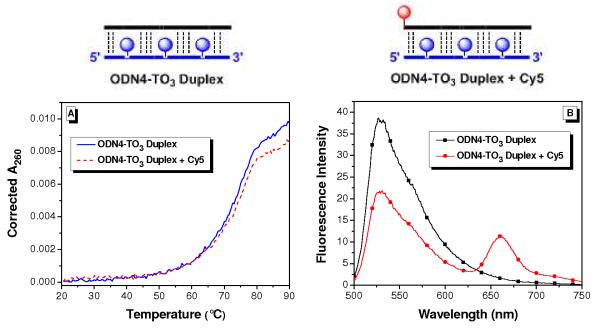
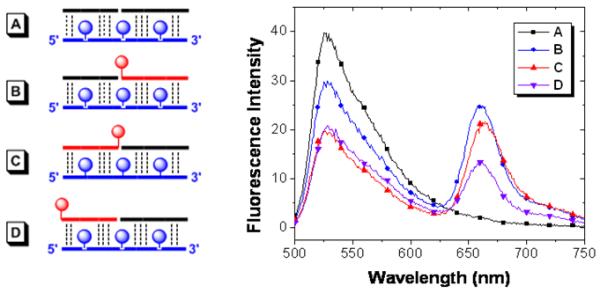
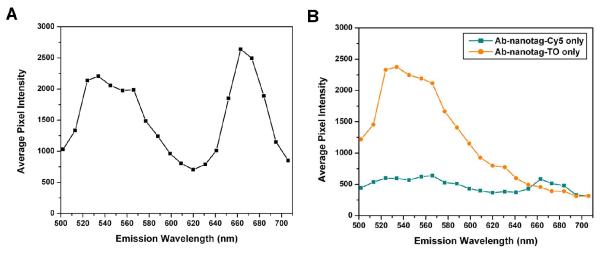
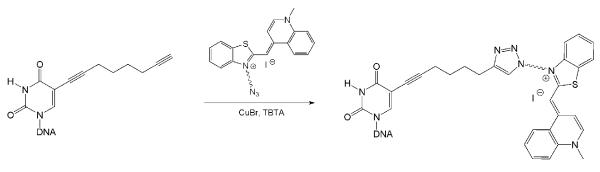
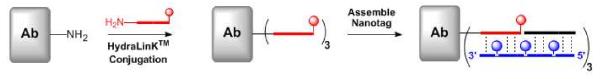
We have synthesized fluorescent DNA duplexes featuring multiple thiazole orange (TO) intercalating dyes covalently attached to the DNA via a triazole linkage. The intercalating dyes stabilize the duplex against thermal denaturation and show bright fluorescence in the green region of the spectrum. The emission color can be changed to orange or red by addition of energy-accepting Cy3 or Cy5 dyes attached covalently to the DNA duplex. The dye-modified DNA duplexes were then attached to a secondary antibody for intracellular fluorescence imaging of centrosomes in Drosophila embryos. Bright fluorescent foci were observed at the centrosomes in both the donor (TO) and acceptor (Cy5) channels, because the energy transfer efficiency is moderate. Monitoring the Cy5 emission channel significantly minimized the background signal because of the large shift in emission wavelength allowed by energy transfer.


Figures

Figure 1
Figure 1
Schematic of noncovalent (top) and covalent (bottom) fluorescent DNA nanotags. A simple linear nanotag is shown, but multidimensional versions are readily assembled.
Figure 2
Figure 2
UV melting curves (A) and fluorescence spectra (B) for DNA duplexes based on ODN1-ODN3. Samples contained 1.0 μM duplex (A) or 0.1 μM duplex (B) in 10 mM NaPi, 100 mM NaCl, 0.1 mM EDTA.
Figure 3
Figure 3
Fluorescence emission spectra recorded for ODN3 duplex in the absence or presence of Cy5 energy acceptor dye on complementary strand. Samples contained 0.1 μM duplex in 10 mM NaPi, 100 mM NaCl, 0.1 mM EDTA. Samples were excited at 488 nm.
Figure 4
Figure 4
Confocal fluorescence imaging of streptavidin-coated polystyrene microspheres (2 μm diameter) conjugated with biotinylated ODN3 duplex (left) or ODN3 duplex labeled with Cy3 (center) or Cy5 (right) FRET acceptor dyes. The following bandpass (BP) or longpass (LP) filters were used: for TO (left) 500-550nm BP, for Cy3 (center) 570-615nm (BP) and for Cy5 (right) 650nm LP. Scale bar is 10 μm.
Figure 5
Figure 5
(A) UV melting curve of trifunctionalized ODN4-TO3 duplex with and without Cy5 label. The initial absorbance (T = 20°C) was subtracted from the rest of the curve to set both curves to zero. (B) Fluorescence emission spectra of ODN4-TO3 duplex with and without Cy5 label. Duplex concentration = 50 nM in both cases.
Figure 6
Figure 6
Fluorescence emission spectra of various ternary duplexes based on trifunctionalized ODN4-TO3 39mer. Duplex concentration = 50 nM in both cases.
Figure 7
Figure 7
Localization of Centrosomin (Cnn) in fixed 0-2 hr syncytical Drosophila embryos. A) Centrosomin localization within the embryo probed with a conventional Alexa488 labeled secondary antibody. Centrosomin stained with an Ab-nanotag conjugate containing TO and Cy5. Images were collected following excitation at 488 nm and collection of either the TO (B) or FRET (C) emission. D) Nuclei are shown by DNA staining (DAPI). The same embryo was imaged for micrographs B-D. Intensity profiles collected along the lines shown in B and C for the TO (E) and FRET (F) emission show that the FRET emission has improved brightness and signal-to-noise ratio compared to the TO emission. Scale bar is 20 μm.
Figure 8
Figure 8
The average fluorescence emission spectra of the Ab-nanotag conjugates in fixed syncytical Drosophila embryos. The emission spectra were acquired after excitation at 488. A) The average pixel intensity at the centrosome of an Ab-nanotag conjugate containing both TO and Cy5 at a given emission wavelength (n = 120 – 140 centrosomes in 4 embryos). B) The average pixel intensity of Ab-nanotag conjugates containing only the TO donor (orange) or Cy5 acceptor (blue).
Chart 1
Chart 1
Scheme 1
Scheme 1
Scheme 2
Scheme 2
Scheme 3
Scheme 3

Similar articles

Cited by

References

    1. Waggoner A. Fluorescent Labels for Proteomics and Genomics. Curr. Opin. Chem. Biol. 2006;10:62–66. - PubMed
    1. Giepmans BNG, Adams SR, Ellisman MH, Tsien RY. The Fluorescent Toolbox for Assessing Protein Location and Function. Science. 2006;312:217–224. - PubMed
    1. Bruchez MJ, Moronne M, Gin P, Weiss S, Alivisatos AP. Semiconductor Nanocrystals as Fluorescent Biological Labels. Science. 1998;281:2013–2016. - PubMed
    1. Zhao X, Bagwe RP, Tan W. Development of Organic-Dye-Doped Silica Nanoparticles in a Reverse Microemulsion. Adv. Mater. 2004;16:173–176.
    1. Burns A, Ow H, Wiesner U. Fluorescent Core=Shell Silica Nanoparticles: Towards “Lab on a Particle” Architectures for Nanobiotechnology. Chem. Soc. Rev. 2006;35:1028–1042. - PubMed

Publication types

LinkOut - more resources