. 2011 Jul 14:12:364.
doi: 10.1186/1471-2164-12-364.

Somatic sex-specific transcriptome differences in Drosophila revealed by whole transcriptome sequencing

Affiliations

Somatic sex-specific transcriptome differences in Drosophila revealed by whole transcriptome sequencing

Peter L Chang et al. BMC Genomics. .

Abstract

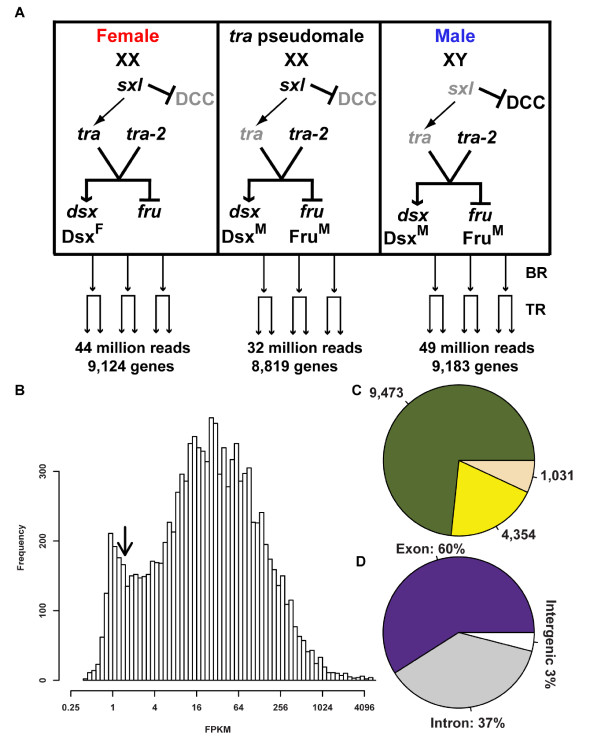
Background: Understanding animal development and physiology at a molecular-biological level has been advanced by the ability to determine at high resolution the repertoire of mRNA molecules by whole transcriptome resequencing. This includes the ability to detect and quantify rare abundance transcripts and isoform-specific mRNA variants produced from a gene.The sex hierarchy consists of a pre-mRNA splicing cascade that directs the production of sex-specific transcription factors that specify nearly all sexual dimorphism. We have used deep RNA sequencing to gain insight into how the Drosophila sex hierarchy generates somatic sex differences, by examining gene and transcript isoform expression differences between the sexes in adult head tissues.

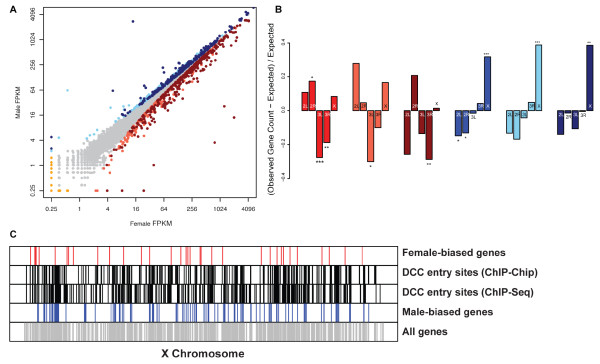
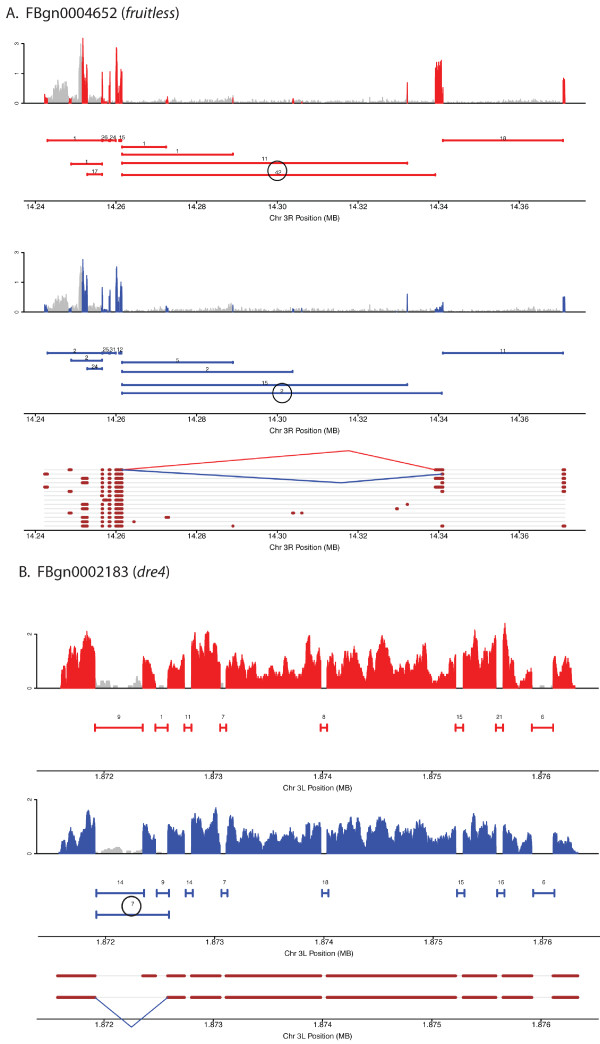
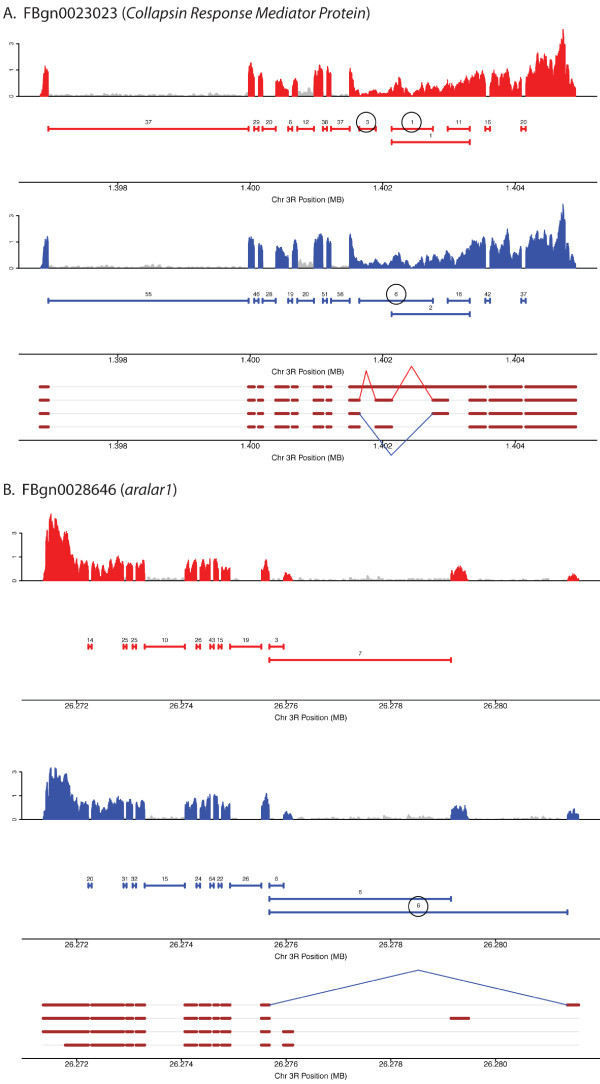
Results: Here we find 1,381 genes that differ in overall expression levels and 1,370 isoform-specific transcripts that differ between males and females. Additionally, we find 512 genes not regulated downstream of transformer that are significantly more highly expressed in males than females. These 512 genes are enriched on the × chromosome and reside adjacent to dosage compensation complex entry sites, which taken together suggests that their residence on the × chromosome might be sufficient to confer male-biased expression. There are no transcription unit structural features, from a set of features, that are robustly significantly different in the genes with significant sex differences in the ratio of isoform-specific transcripts, as compared to random isoform-specific transcripts, suggesting that there is no single molecular mechanism that generates isoform-specific transcript differences between the sexes, even though the sex hierarchy is known to include three pre-mRNA splicing factors.

Conclusions: We identify thousands of genes that show sex-specific differences in overall gene expression levels, and identify hundreds of additional genes that have differences in the abundance of isoform-specific transcripts. No transcription unit structural feature was robustly enriched in the sex-differentially expressed transcript isoforms. Additionally, we found that many genes with male-biased expression were enriched on the × chromosome and reside adjacent to dosage compensation entry sites, suggesting that differences in sex chromosome composition contributes to dimorphism in gene expression. Taken together, this study provides new insight into the molecular underpinnings of sexual differentiation.


Figures

Figure 1
Figure 1
Experimental Design and Sequence Read Mapping (A) Illumina reads were sequenced and mapped from libraries generated from Drosophila female, male, and tra pseudomale head tissues. For each genotype, there are three independent biological samples, which were sequenced with two technical replicates. The sex hierarchy gene activity and sex chromosome composition for each genotype is shown. Grey indicates that no functional protein is made. The dosage compensation complex (DCC) is not active in females and tra pseudomales that have two × chromosomes. The number of sequence reads and genes that the reads map to are shown. The number of biological (BR) and technical replicates (TR) are indicated. (B) FPKM distribution of all genes covered by sequence reads (green in C). Arrow at lower tail of distribution indicates approximately where FPKM values are for dsx and fru. (C) Illumina reads mapped to 9,473 genes (green) with FPKM values of at least 1in all six replicates within at least one genotype. There were 4,354 genes (yellow) that had reads mapped to the gene, but not with FPKM greater than 1 in all six replicates within at least one genotype. There were 1,031 genes (beige) that had no reads mapped to the gene. (D) Illumina reads were mapped to exons (60%, purple), introns (37%, grey), and intergenic regions (3%; white).
Figure 2
Figure 2
Genes with overall sex differential expression and their chromosome distribution. (A) Dot plot showing comparison of gene expression in female and male. Genes with significantly higher expression in male (blue), upstream of tra (light blue) or downstream of tra (dark blue) are indicated. Genes with significantly higher expression in female (red), upstream of tra (light red) or downstream of tra (dark red). Yellow dots indicate genes with expression in only female or male genotype. (B) Bar plot showing chromosomal enrichment of genes with female-biased (red), female-biased expression upstream of tra (light red), female-biased expression downstream of tra (dark red), male-biased expression (blue), male-biased expression upstream of tra (light blue), and male-biased expression downstream of tra (dark blue). Asterisks indicate significant over- or under-enrichment at three different significance levels (P < 0.05, 0.01 and 0.001 are indicated by *, **, and ***, respectively). (C) Distribution of genes with female-biased (red), or male-biased (blue) expression, within DCC-bound regions (black), or expressed genes among any genotype (gray) along the × chromosome are shown. The DCC-bound regions include those found by ChIP-Chip and ChIP-seq studies [40,41].
Figure 3
Figure 3
Coverage plots, junction plots and gene models for genes with sex-differential transcript isoforms, data for (A) doublesex and (B) sex lethal is shown. Throughout red and blue indicate data from female and male, respectively. Coverage plots for exon sequences are shown with peaks in red and blue indicating coverage from RNA from females and males, respectively; grey indicates non-exonic gene regions as annotated by Flybase. Junction plots are shown as solid horizontal lines beneath the coverage plots. The number above each line indicates the number of sequence reads that span a junction. All numbers are based on 1 million mapped reads. Flybase gene models are shown at the bottom of each panel with exon regions shown in brown. Female- and male-preferred junctions are indicated by red and blue lines between donor and acceptor sites on the gene models. The circled numbers in the junction plots correspond to the female and male preferred junctions.
Figure 4
Figure 4
Coverage plots, junction plots and gene models for genes with sex-differential transcript isoforms, data for (A) fruitless and (B) dre4 is shown. Throughout red and blue indicate data from female and male, respectively. Coverage plots for exon sequences are shown with peaks in red and blue indicating coverage from RNA from females and males, respectively; grey indicates non-exonic gene regions as annotated by Flybase. Junction plots are shown as solid horizontal lines beneath the coverage plots. The number above each line indicates the number of sequence reads that span a junction. All numbers are based on 1 million mapped reads. Flybase gene models are shown at the bottom of each panel with exon regions shown in brown. Female- and male-preferred junctions are indicated by red and blue lines between donor and acceptor sites on the gene models. The circled numbers in the junction plots correspond to the female and male preferred junctions.
Figure 5
Figure 5
Coverage plots, junction plots and gene models for genes with sex-differential transcript isoforms, data for (A) Collapsin Response Mediator Protein and (B) aralar1 is shown. Throughout red and blue indicate data from female and male, respectively. Coverage plots for exon sequences are shown with peaks in red and blue indicating coverage from RNA from females and males, respectively; grey indicates non-exonic gene regions as annotated by Flybase. Junction plots are shown as solid horizontal lines beneath the coverage plots. The number above each line indicates the number of sequence reads that span a junction. All numbers are based on 1 million mapped reads. Flybase gene models are shown at the bottom of each panel with exon regions shown in brown. Female- and male-preferred junctions are indicated by red and blue lines between donor and acceptor sites on the gene models. The circled numbers in the junction plots correspond to the female and male preferred junctions.

References

    1. Venter JC, Adams MD, Myers EW, Li PW, Mural RJ, Sutton GG, Smith HO, Yandell M, Evans CA, Holt RA. et al.The sequence of the human genome. Science. 2001;291(5507):1304–1351. doi: 10.1126/science.1058040. - DOI - PubMed
    1. Consortium IHGS. Finishing the euchromatic sequence of the human genome. Nature. 2004;431(7011):931–945. doi: 10.1038/nature03001. - DOI - PubMed
    1. Consortium. Genome sequence of the nematode C. elegans: a platform for investigating biology. Science. 1998;282(5396):2012–2018. - PubMed
    1. Adams MD, Celniker SE, Holt RA, Evans CA, Gocayne JD, Amanatides PG, Scherer SE, Li PW, Hoskins RA, Galle RF. et al.The genome sequence of Drosophila melanogaster. Science. 2000;287(5461):2185–2195. doi: 10.1126/science.287.5461.2185. - DOI - PubMed
    1. Soller M. Pre-messenger RNA processing and its regulation: a genomic perspective. Cell Mol Life Sci. 2006;63(7-8):796–819. doi: 10.1007/s00018-005-5391-x. - DOI - PMC - PubMed

Publication types

LinkOut - more resources