

Developmental trajectories of forward and backward digit spans in deaf children with cochlear implants
- PMID: 21756483
- PMCID: PMC3304450
- DOI: 10.1179/146701011X13001035752534
Developmental trajectories of forward and backward digit spans in deaf children with cochlear implants
Abstract
Background: Accounting for outcome variability among pediatric cochlear implant (CI) recipients is an enduring clinical challenge. Short-term memory and working memory (STM/WM), as indexed by digit span forward (DSF) and digit span backward (DSB), have been shown to be strongly correlated with speech and language (S/L) outcomes. The enormous variability observed in conventional outcome measures of S/L may reflect individual differences in STM/WM.
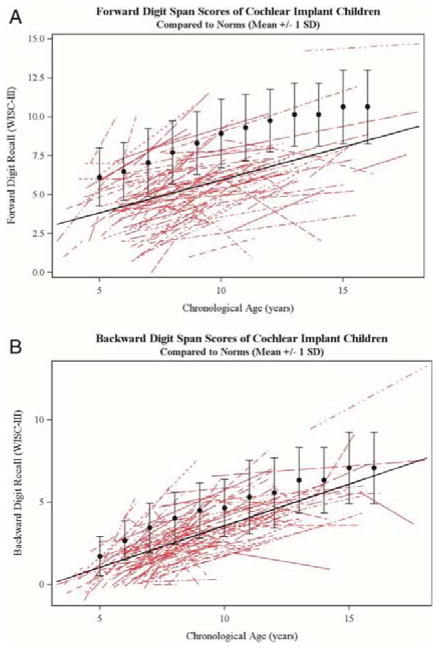
Methods: Repeated measure auditory digit spans were obtained from 110 children (age 3-15 years; mean 7.2 years) with at least 2 years of CI use. Growth curves were computed for each child, and linear functions were fit to both DSF and DSB. Slopes and intercepts were used as parameters in mixed-models to assess relations between STM/WM capacity change over time and S/L outcome measures including vocabulary (PPVT), open-set set spoken word recognition (PBK), and sentence perception (HINT-C).
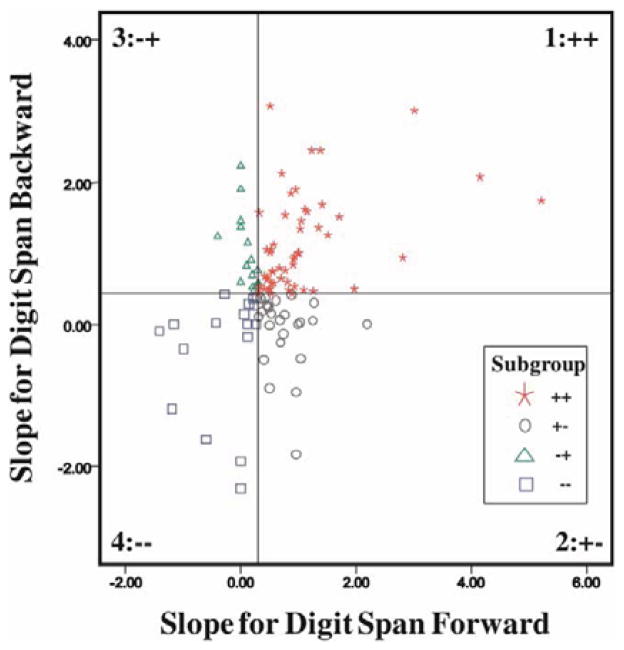
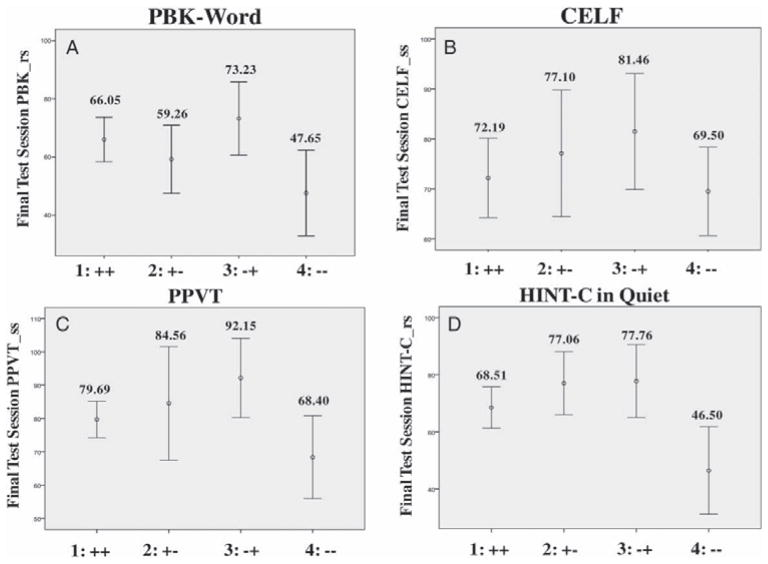
Results: For DSF, the percent of the sample more than 1 SD below the norm at each age ranged from 54 to 90% (mean = 66.5%). For DSB, the percent of the sample more than 1 SD below the norm at each age ranged from 23 to 42% (mean = 34.5%) at ages where there were at least five children. Four subgroups within our CI sample emerged: (Subgroup 1) children demonstrating age-appropriate growth in both DSF and DSB scores over time (49/110, 44.55%); (Subgroup 2) children demonstrating age appropriate growth in DSF over time but below average growth in DSB over time (23/110, 20.91%); (Subgroup 3) children demonstrating below average growth in DSF over time but age-appropriate growth in DSB over time (19/110, 17.27%); and (Subgroup 4) children demonstrating below average growth in both DSF and DSB over time (19/110, 17.27%). For all tests except CELF-3, Subgroup 4 demonstrated the poorest performance among the four DS slope subgroups. Significant differences were observed between Subgroup 1 and Subgroup 4 on last visit PBK-Word (P = 0.029), PPVT (P = 0.018), and HINT-C in Quiet (P = 0.001), but not CELF-3 (P = 0.433).
Conclusion: The findings from this longitudinal study suggest that differences in the rate of development of STM/WM may influence S/L outcomes in children with CIs. The clinical implications of these findings are significant because they indicate that the rate of development of STM/WM, and not just the actual level of STM/WM at a single time point, predicts later S/L development in this clinical population. Targeted interventions to improve developmental rate of verbal STM/WM may hold promise for enhancing S/L skills in children with CIs.
Conflict of interest statement
Figures
References
-
- Baddeley A. Working Memory, Thought And Action. Oxford: Oxford University Press; 2007.
-
- Cochlear Implants in Adults and Children. NIH Consens Statement. 1995 May 15–17;13(2):1–30. - PubMed
Publication types
MeSH terms
Grants and funding
LinkOut - more resources
Full Text Sources
Medical