. 2011 May;15(5):571-81.
doi: 10.5588/ijtld.10.0483.

Antiretroviral therapy and the control of HIV-associated tuberculosis. Will ART do it?

Affiliations

Antiretroviral therapy and the control of HIV-associated tuberculosis. Will ART do it?

S D Lawn et al. Int J Tuberc Lung Dis. 2011 May.

Abstract

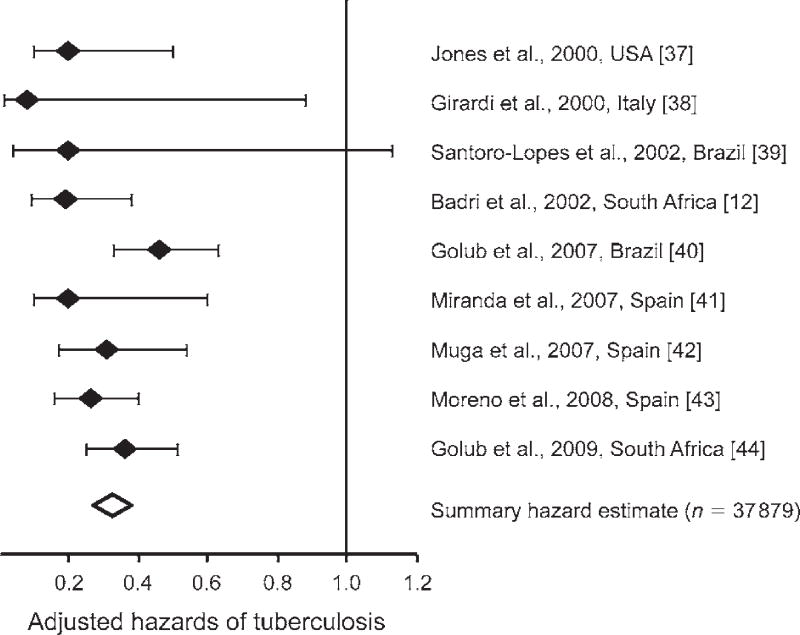
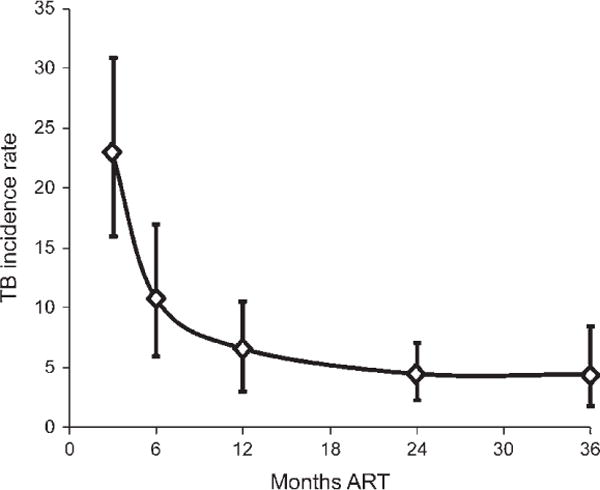
The human immunodeficiency virus (HIV) associated tuberculosis (TB) epidemic remains an enormous challenge to TB control in countries with a high prevalence of HIV. In their 1999 article entitled 'Will DOTS do it?', De Cock and Chaisson questioned whether the World Health Organization's DOTS Strategy could control this epidemic. Data over the past 10 years have clearly shown that DOTS is insufficient as a single TB control intervention in such settings because it does not address the fundamental epidemiological interactions between TB and HIV. Immunodeficiency is a principal driver of this epidemic, and the solution must therefore include immune recovery using antiretroviral therapy (ART). Thus, in the era of global ART scale-up, we now ask the question, 'Will ART do it?' ART reduces the risk of TB by 67% (95%CI 61-73), halves TB recurrence rates, reduces mortality risk by 64-95% in cohorts and prolongs survival in patients with HIV-associated drug-resistant TB. However, the cumulative lifetime risk of TB in HIV-infected individuals is a function of time spent at various CD4-defined levels of risk, both before and during ART. Current initiation of ART at low CD4 cell counts (by which time much HIV-associated TB has already occurred) and low effective coverage greatly undermine the potential impact of ART at a population level. Thus, while ART has proven a critical intervention for case management of HIV-associated TB, much of its preventive potential for TB control is currently being squandered. Much earlier ART initiation with high coverage is required if ART is to substantially influence the incidence of TB.


Figures

Figure 1
Figure 1
Tuberculosis (TB) incidence rates (cases/100 person-years) among human immunodeficiency virus infected patients prior to availability of antiretroviral therapy in South Africa and Italy. Rates are strongly associated with blood CD4 counts (cells/μl). Data adapted from Badri et al., 2002, and Antonucci et al., 1995.
Figure 2
Figure 2
Tuberculosis (TB) incidence rates (cases/100 person-years) among human immunodeficiency virus infected patients in Cape Town, South Africa, prior to availability of antiretroviral therapy (ART) and during ART. Patients are stratified according to World Health Organization (WHO) stage of disease and baseline blood CD4 count (cells/μl). ART is seen to be associated with marked reductions in TB incidence rates. Data adapted from Badri et al., 2002.
Figure 3
Figure 3
Adjusted hazards of tuberculosis, comparing human immunodeficiency virus infected patients receiving antiretroviral therapy (ART) with those not receiving ART. Data from nine cohorts in Africa, Europe, and North and South America are presented together with a summary estimate derived from a meta-analysis. Data and figure adapted from Lawn et al., 2010. References cited in brackets pertain to reference .
Figure 4
Figure 4
Tuberculosis (TB) incidence rates (cases per 100 person-years with 95% confidence intervals) during 36 months of antiretroviral therapy (ART) in a South African cohort. Rates are seen to continue to fall steeply during the first year of ART but reach a plateau between 2–3 years of ART at a rate of just under 5 cases/100 person-years. Data adapted from Lawn et al., 2006, and Lawn et al., 2009.
Figure 5
Figure 5
Tuberculosis (TB) incidence rates (cases/100 person-years, with 95% confidence intervals) in South African patients receiving antiretroviral therapy (ART). CD4 cell counts (cells/μl) were measured at baseline and every 4 months during ART. TB incidence rates stratified by updated CD4 cell counts during ART are presented. TB risk was extremely high while CD4 counts were <200 cells/μl, intermediate at counts of 200–500 cells/μl and lowest once CD4 counts exceeded a threshold of 500 cells/μl. Graph adapted from Lawn et al., 2009.
Figure 6
Figure 6
Changes in prevalence (%) of HIV-associated (HIV-positive) and non-HIV-associated (HIV-negative) tuberculosis (TB) in a community during rapid scale-up of antiretroviral therapy between 2005 and 2008. A 75% reduction in prevalence of HIV-associated TB was observed. Data adapted from Middelkoop et al., 2010.
Figure 7
Figure 7
Graph showing increasing tuberculosis (TB) incidence rates (cases/100 person-years and 95% confidence intervals) with falling CD4 counts (cells/μl) in a South African cohort of HIV-infected patients prior to availability of antiretroviral therapy (ART; unshaded area) and the subsequent reduction in incidence rates with rising CD4 counts during ART (shaded area). The shape of the curve at the time of ART initiation will depend on the intensity of TB screening just prior to ART initiation. Cumulative TB risk will depend strongly on the period that patients spend at low CD4 counts both before and during ART. Data adapted from Holmes et al., 2006, and Lawn et al., 2009.
Figure 8
Figure 8
Mathematical modelling to estimate the impact of antiretroviral therapy (ART) on tuberculosis (TB) notification rates in South Africa. The model is fitted to the HIV epidemic curve and the TB notification rates for the country. Each graph shows TB notification rates among HIV-negative individuals (dark blue line), HIV-infected people not on ART (pink line), HIV-positive people on ART (light blue line) and the whole population (red line). The model assumes that people are tested for HIV on average once a year and start ART when their CD4 count falls to <200 cells/μl (A), <350 cells/μl (B) or 500 cells/μl (C), or as soon as they test positive for HIV (D).

References

    1. United Nations. The Millennium Development Goals report 2008. New York, NY, USA: United Nations; 2008. http://www.un.org/millenniumgoals/. Accessed February 2011.
    1. World Health Organization. Global plan to stop TB 2006–2015. Geneva, Switzerland: WHO; Stop TB Partnership. http://www.stoptb.org/global/plan/ Accessed February 2011.
    1. World Health Organization. Epidemiology, strategy, financing. Geneva, Switzerland: WHO; 2009. Global tuberculosis control 2009. (WHO/HTM/TB/2009.411). http://www.who.int/tb/publications/global_report/2009/en/index.html Accessed February 2011.
    1. De Cock KM, Chaisson RE. Will DOTS do it? A reappraisal of tuberculosis control in countries with high rates of HIV infection. Int J Tuberc Lung Dis. 1999;3:457–465. - PubMed
    1. World Health Organization. Report of a joint WHO HIV/AIDS and TB Department meeting, 2008. Geneva, Switzerland: WHO; 2008. WHO Three I’s meeting. http://www.who.int/hiv/pub/meetingreports/WHO_3Is_meeting_report.pdf Accessed February 2011.

Publication types

MeSH terms