

Error-related processing following severe traumatic brain injury: an event-related functional magnetic resonance imaging (fMRI) study
- PMID: 21756946
- PMCID: PMC3199028
- DOI: 10.1016/j.ijpsycho.2011.06.019
Error-related processing following severe traumatic brain injury: an event-related functional magnetic resonance imaging (fMRI) study
Abstract
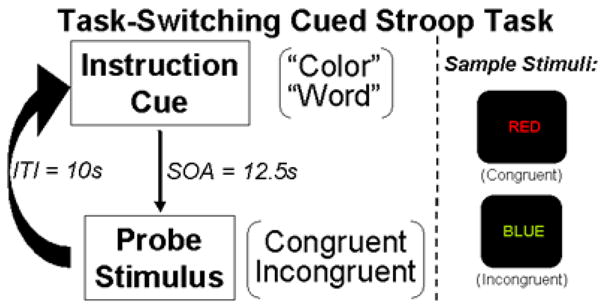
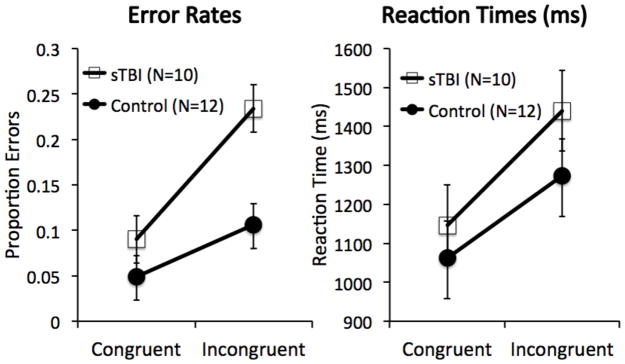
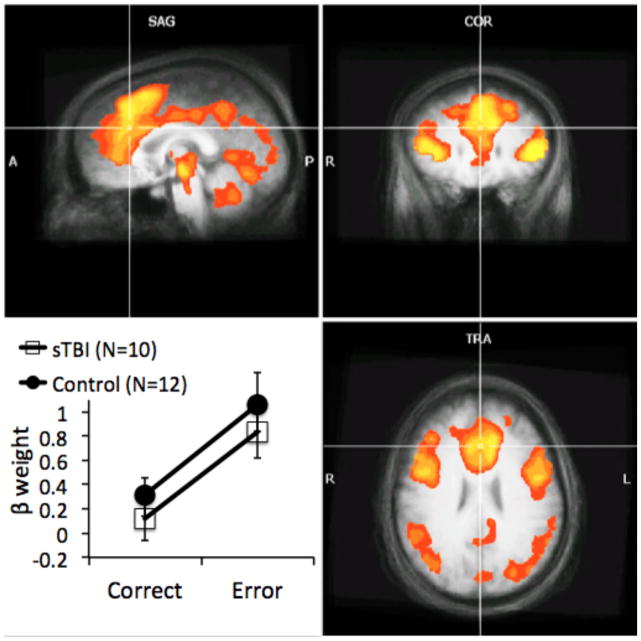
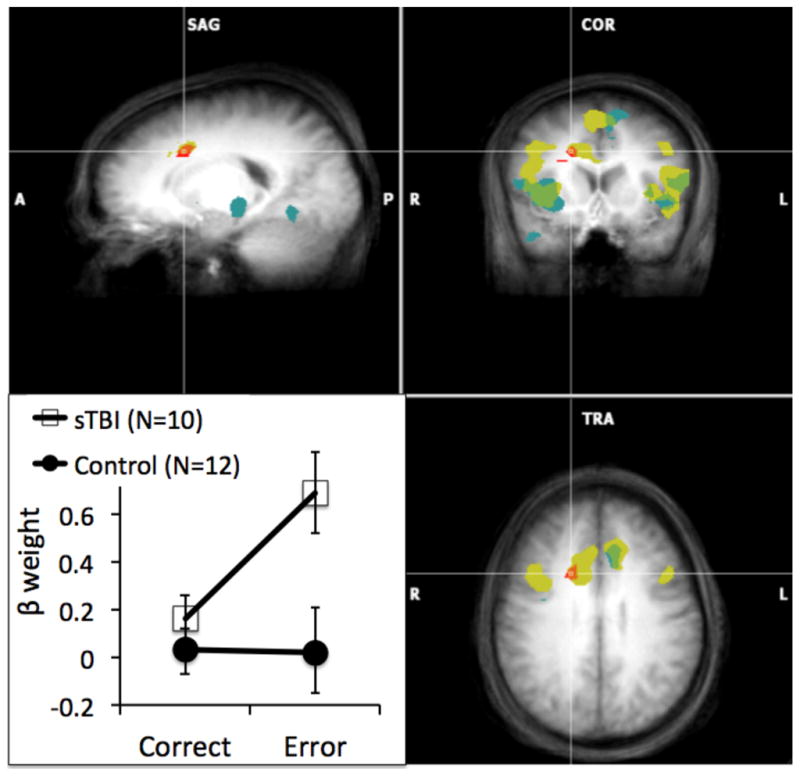
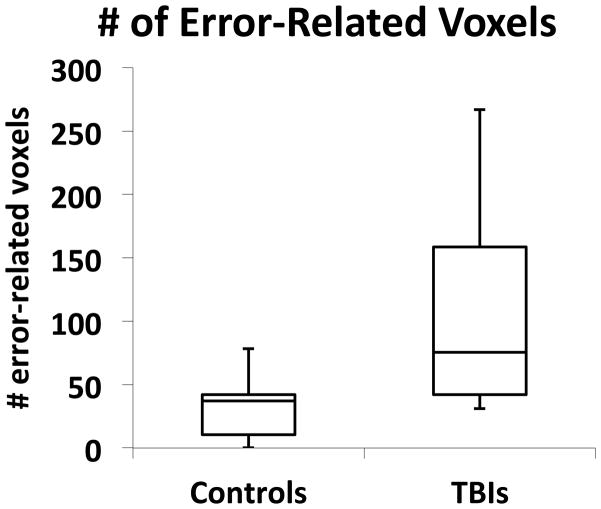
Continuous monitoring of one's performance is invaluable for guiding behavior towards successful goal attainment by identifying deficits and strategically adjusting responses when performance is inadequate. In the present study, we exploited the advantages of event-related functional magnetic resonance imaging (fMRI) to examine brain activity associated with error-related processing after severe traumatic brain injury (sTBI). fMRI and behavioral data were acquired while 10 sTBI participants and 12 neurologically-healthy controls performed a task-switching cued-Stroop task. fMRI data were analyzed using a random-effects whole-brain voxel-wise general linear model and planned linear contrasts. Behaviorally, sTBI patients showed greater error-rate interference than neurologically-normal controls. fMRI data revealed that, compared to controls, sTBI patients showed greater magnitude error-related activation in the anterior cingulate cortex (ACC) and an increase in the overall spatial extent of error-related activation across cortical and subcortical regions. Implications for future research and potential limitations in conducting fMRI research in neurologically-impaired populations are discussed, as well as some potential benefits of employing multimodal imaging (e.g., fMRI and event-related potentials) of cognitive control processes in TBI.
Copyright © 2011 Elsevier B.V. All rights reserved.
Figures
References
-
- Anderson V, Levin HS, Jacobs R. Executive functions after frontal lobe injury: A developmental perspective. In: Stuss DT, Knight RT, editors. Principles of Frontal Lobe Function. New York: Oxford University Press; 2002. pp. 504–527.
-
- Beck AT, Steer RA, Brown GK. Beck Depression Inventory. 2. USA: The Psychological Corporation; 1996. (BDI-II)
-
- Bigler ED. Neuropathology of traumatic brain injury. In: Bigler ED, editor. Traumatic Brain Injury. Austin, TX: Pro-ed; 1990.
-
- Blair JR, Spreen O. Predicting premorbid IQ: A revision of the National Adult Reading Test. The Clinical Neuropsychologist. 1989;3:129–136.
-
- Bond MR. Neurobehavioral sequelae of closed head injury. In: Grant I, Adams KM, editors. Neuropsychological assessment of neuropsychological disorders. New York: Oxford University Press; 1986. pp. 347–373.
Publication types
MeSH terms
Substances
Grants and funding
LinkOut - more resources
Full Text Sources
