

The 1918 influenza pandemic hastened the decline of tuberculosis in the United States: an age, period, cohort analysis
- PMID: 21757102
- PMCID: PMC3139993
- DOI: 10.1016/j.vaccine.2011.02.053
The 1918 influenza pandemic hastened the decline of tuberculosis in the United States: an age, period, cohort analysis
Abstract
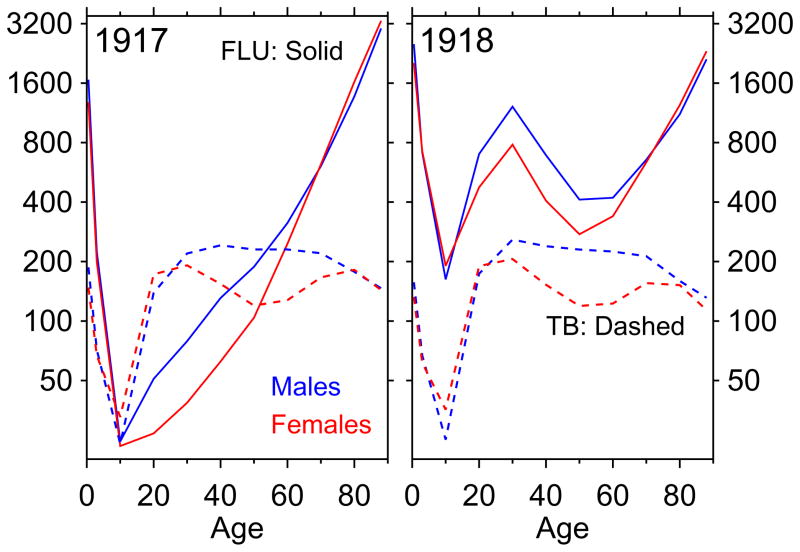
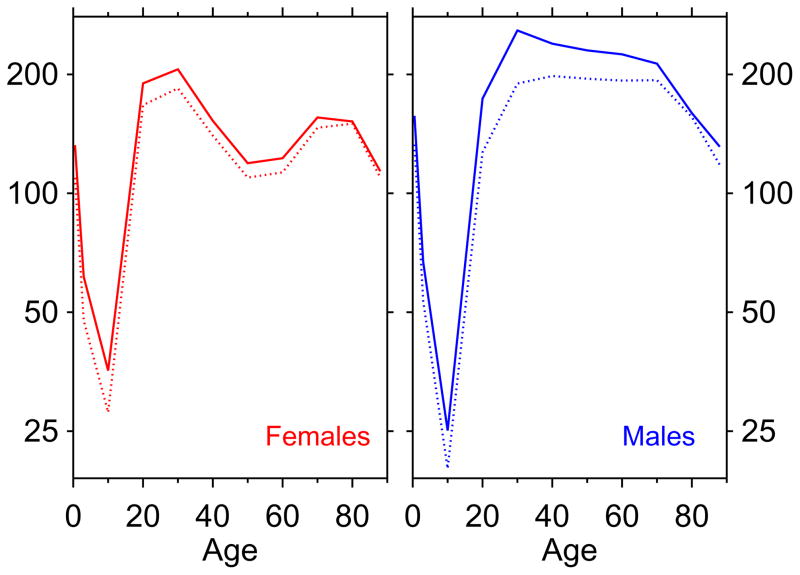
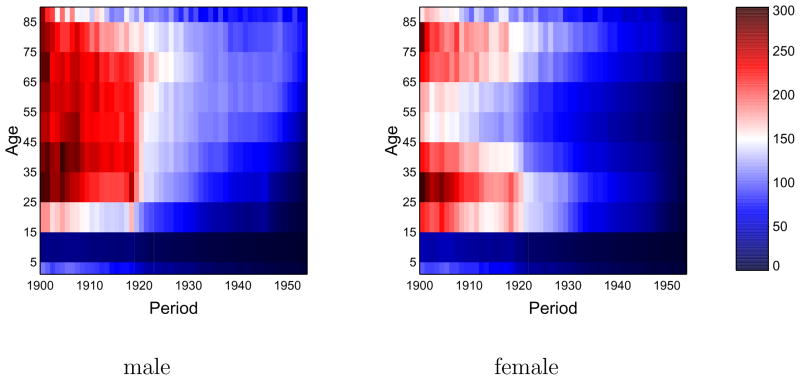
The effect of the 1918 influenza pandemic on other diseases is a neglected topic in historical epidemiology. This paper takes up the hypothesis that the influenza pandemic affected the long-term decline of tuberculosis through selective mortality, such that many people with tuberculosis were killed in 1918, depressing subsequent tuberculosis mortality and transmission. Regularly collected vital statistics data on mortality of influenza and tuberculosis in the US are presented and analyzed demographically. The available population-level data fail to contradict the selection hypothesis. More work is needed to understand fully the role of multiple morbidities in the 1918 influenza pandemic.
Keywords: 1918 pandemic; Lexis surface; age; cohort; demography; influenza; mortality; period; selection; tuberculosis.
Copyright © 2011 Elsevier Ltd. All rights reserved.
Figures
References
-
- Abbott AC. The death rate from tuberculosis [letter] Science. 1922;56 (1449):387–388. - PubMed
-
- Arthur WB, Vaupel JW. Some general relationships in population dynamics. Population Index. 1984;50 (2):214–226. - PubMed
-
- Blower SM, McLean AR, Porco TC, Small PM, Hopewell PC, Sanchez MA, Moss AR. The intrinsic transmission dynamics of tuberculosis epidemics. Nature Medicine. 1995;1 (8):815–821. - PubMed
-
- Comstock GW. Frost revisited: The modern epidemiology of tuberculosis. American Journal of Epidemiology. 1975;101 (5):363–382. - PubMed
-
- Grove RD, Hetzel AM. Vital statistics rates in the United States, 1940–1960. United States Department of Health, Education, and Welfare: National Center for Health Statistics; Washington DC: 1968.
