

Upper gastrointestinal haemorrhage and deprivation: a nationwide cohort study of health inequality in hospital admissions
- PMID: 21757448
- PMCID: PMC3292712
- DOI: 10.1136/gutjnl-2011-300186
Upper gastrointestinal haemorrhage and deprivation: a nationwide cohort study of health inequality in hospital admissions
Abstract
Objective: Inequalities in health are well recognized in cardiovascular disease and cancer, but in comparison, we have minimal understanding for upper gastrointestinal bleeding. Since furthering our understanding of such inequality signposts preventable disease, we investigated in detail the association between upper gastrointestinal bleeding and socioeconomic status.
Design: Population-based cohort study.
Setting: All English National Health Service hospitals.
Population: English adult population, 1 January 2001 to 31 December 2007.
Exposure measures: Deprivation scores defined according to quintiles of neighbourhood areas ranked by the Indices of Multiple Deprivation for England 2007.
Outcome measures: Rates of all adult admissions coded with a primary diagnosis of upper gastrointestinal bleed were analysed by deprivation quintile and adjusted for age, sex, region and year using Poisson regression.
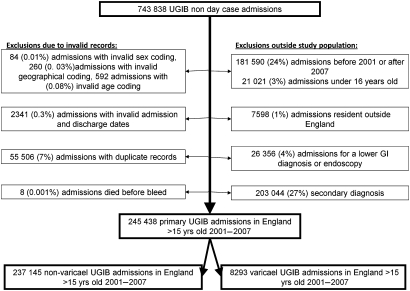
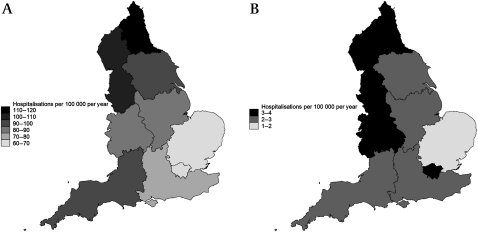
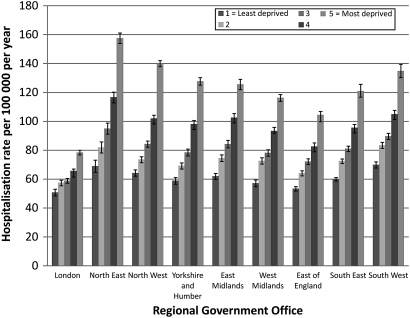
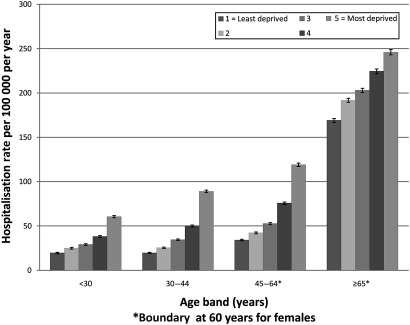
Results: The annual hospitalization rate for non-variceal haemorrhage was 84.6 per 100,000 population (95% CI 83.5 to 84.1; n=237,145), and for variceal haemorrhage, it was 2.83 per 100,000 population (95% CI 2.87 to 2.99; n=8291). There was a twofold increase in the hospitalization rate ratio for non-variceal haemorrhage from the most deprived areas compared to the least deprived (2.00, 95% CI 1.98 to 2.03). The ratio for variceal haemorrhage was even more pronounced (2.49, 95% CI 2.32 to 2.67). Inequality increased over the study period (non-variceal p<0.0001, variceal p=0.0068), and adjusting for age and sex increased the disparity between deprived and affluent areas. Case fatality did not have a similar socioeconomic gradient.
Conclusion: Both variceal and non-variceal haemorrhage hospitalization rates increased with deprivation, and there was a similar gradient in all areas of the country and in all age bands. The existence of such a steep gradient suggests that there are opportunities to reduce hospitalizations down to the low rates seen in the most affluent, and thus, there is the potential to prevent almost 10,000 admissions and over 1000 deaths a year.
Conflict of interest statement
Figures

References
-
- Marmot M, Atkinson T, Bell J, et al. Strategic review of health inequalities in England post-2010. The Marmot review, 2010. http://www.marmotreview.org/AssetLibrary/pdfs/Reports/FairSocietyHealthy... (accessed 5 Nov 2010).
-
- Button LA, Roberts SE, Evans PA, et al. Hospitalized incidence and case fatality for upper gastrointestinal bleeding from 1999 to 2007: a record linkage study. Aliment Pharmacol Ther 2011;33:64–76 - PubMed
-
- Communities and Local Government The English indices of deprivation 2007. Communities and Local Goverment Publications, 2007. http://www.communities.gov.uk/documents/communities/pdf/733520.pdf (accessed 29 Apr 2011).
-
- Azim L, Henryk O, Daniel E. Compendium of clinical and health indicators: data definitions and user guide for computer files. National Centre for Health Outcomes Development, 2008; http://www.nchod.nhs.uk/NCHOD/ePublish.nsf/fe55addc24ce637165256cd200291... (accessed 23 Dec 2008).
Publication types
MeSH terms
LinkOut - more resources
Full Text Sources
Other Literature Sources
Medical