. 2011 Jul 14;11(8):10.1167/11.8.10 10.
doi: 10.1167/11.8.10.

The same binding in contour integration and crowding

Affiliations

The same binding in contour integration and crowding

Ramakrishna Chakravarthi et al. J Vis. .

Abstract

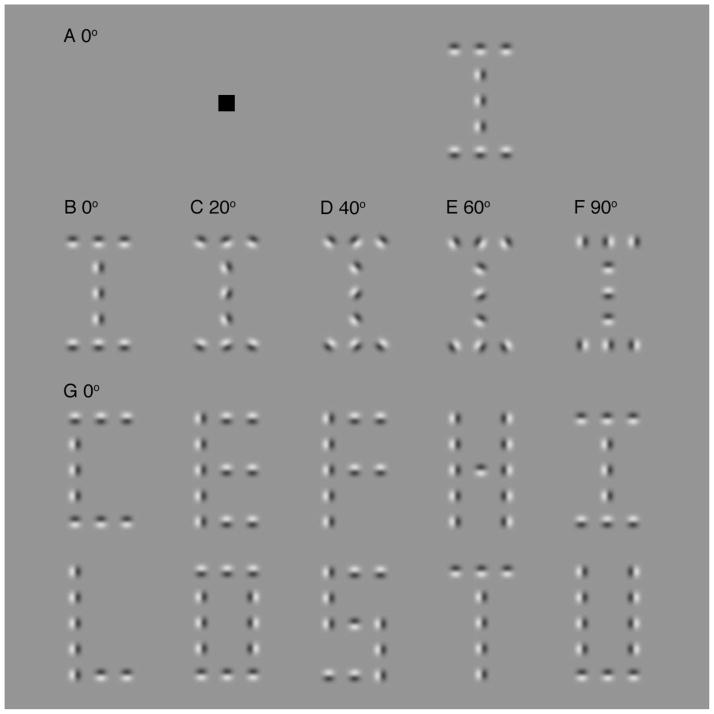
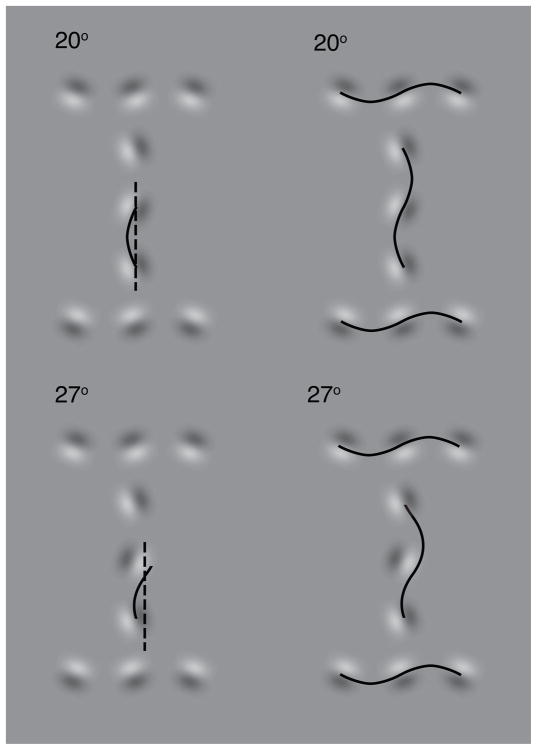
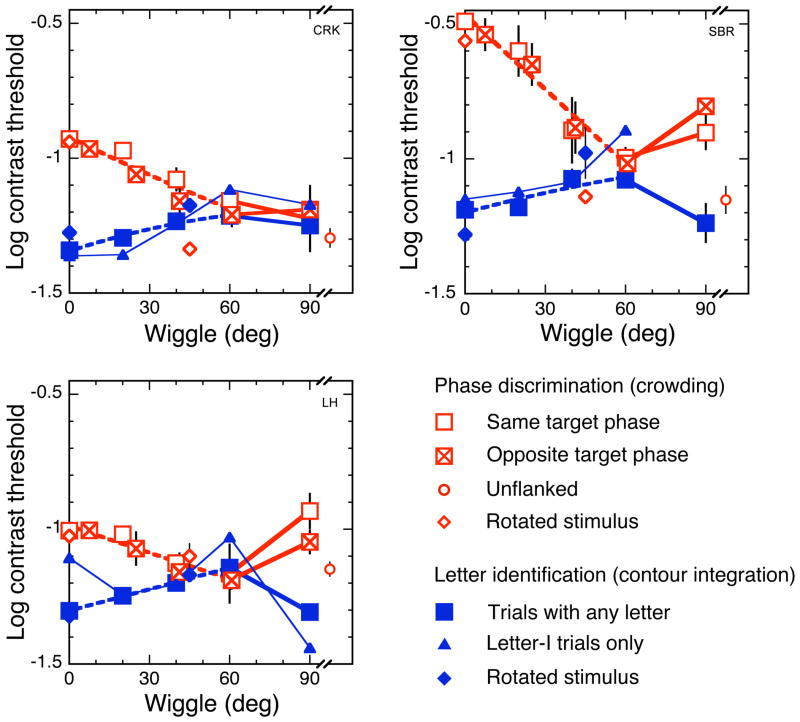
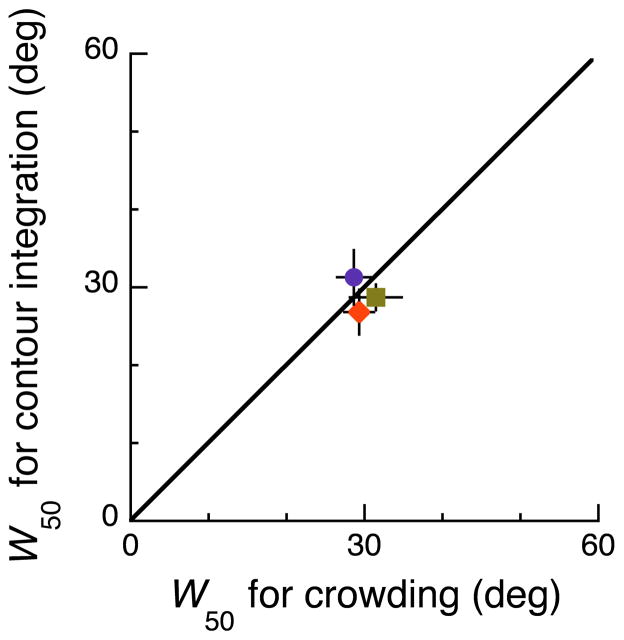
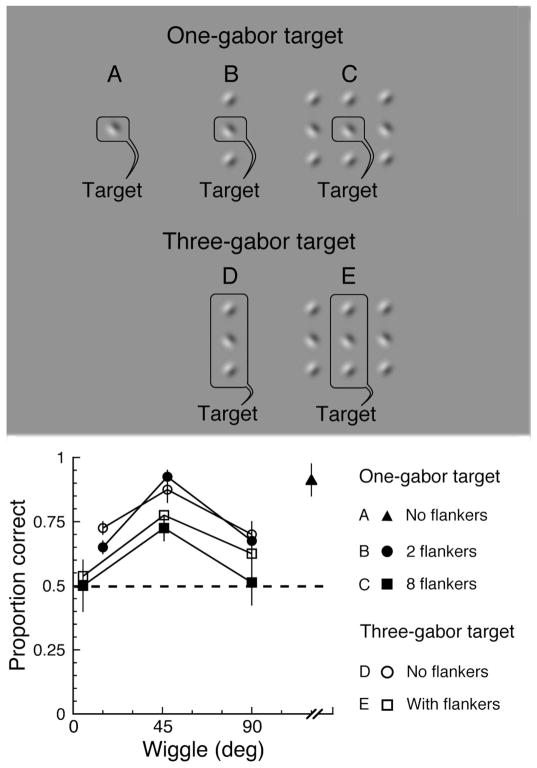
Binding of features helps object recognition in contour integration but hinders it in crowding. In contour integration, aligned adjacent objects group together to form a path. In crowding, flanking objects make the target unidentifiable. However, to date, the two tasks have only been studied separately. K. A. May and R. F. Hess (2007) suggested that the same binding mediates both tasks. To test this idea, we ask observers to perform two different tasks with the same stimulus. We present oriented grating patches that form a "snake letter" in the periphery. Observers report either the identity of the whole letter (contour integration task) or the phase of one of the grating patches (crowding task). We manipulate the strength of binding between gratings by varying the alignment between them, i.e., the Gestalt goodness of continuation, measured as "wiggle." We find that better alignment strengthens binding, which improves contour integration and worsens crowding. Observers show equal sensitivity to alignment in these two very different tasks, suggesting that the same binding mechanism underlies both phenomena. It has been claimed that grouping among flankers reduces their crowding of the target. Instead, we find that these published cases of weak crowding are due to weak binding resulting from target-flanker misalignment. We conclude that crowding is mediated solely by the grouping of flankers with the target and is independent of grouping among flankers.


Figures

Figure 1
Figure 1. The effects of similarity and alignment in crowding
Each triplet consists of a target bar between two flanking bars. While fixating a square, judge the orientation of the target bar above or below fixation. Left. The effect of similarity: The upper and lower triplets in the left column differ only in the orientation of the flankers. While fixating on the left square, it is hard to tell that the upper target, which is similar to its flankers (+5 deg), is perfectly vertical but easy to tell that for the lower target, which is dissimilar to its flankers (+20 deg). Right. The effect of alignment: In the right column, the two triplets differ in alignment. The similarity of the flankers to the target is the same in both cases (+20 deg). While fixating on the right square, the upper target, which is aligned with its flankers, appears tilted anticlockwise from the horizontal whereas the lower target, which is misaligned with its flankers, appears perfectly vertical, as it is. The known differences in crowding between the upper and lower visual fields are too small to matter here; turning the page upside down has hardly any effect on these demonstrations.
Figure 2
Figure 2. Snake letters
A: A “snake” letter made of gabors is presented 10 deg from fixation in the right visual field. A gabor is a grating patch (Eq. 1). The task is either to identify the letter or to report the phase of the central gabor (i.e., to indicate whether the light half of the gabor was on the right side or the left). B–F: Examples of letters (all “I”) with wiggles of 0, 20, 40, 60 and 90 deg. G: All 10 letters, with zero wiggle, used in the contour integration task.
Figure 3
Figure 3. How to measure wiggle
The displayed value is wiggle. The orientation jitter is ±20°. The phase of the central target gabor is 0° in the upper row and 180° in the lower row. To measure a letter’s wiggle, select a chain of gabors along a straight part of the original letter’s path. Select a pair of adjacent gabors in that chain. Fit half a period of a sine wave, making tangential contact (at each end) with the dark-to-light transition of each gabor in that pair. The period of the sine fit is set to twice the center-to-center spacing of the gabors. The sine’s position, orientation, amplitude, and phase are adjusted for best fit. The angle that the sine wave (solid) makes with its own axis (dashed) is that pair’s wiggle. Repeat this for every pair of adjacent gabors in all straight chains in the letter. The average wiggle of all such gabor pairs is the letter’s wiggle. The left column shows a single half-sine fit. The right column shows them all. Note that the sine waves are tangent to the dark-to-light transitions of the gabors, not the light-to-dark transitions. At the point of contact, the dark side of the transition is always to the right of the sine as the sin( ) argument increases. The sine fit need not pass through the center of the gabor and its axis need not be aligned with the letter path.
Figure 4
Figure 4. Three observers’ results for both tasks
Increasing wiggle from 0 to 60 deg makes letter identification (solid symbols) harder and phase discrimination (open symbols, including the crossed squares) easier. In particular, contrast threshold for letter identification (solid squares) increases with wiggle, while contrast threshold for phase discrimination (open and crossed squares) of a single gabor embedded among other gabors decreases with wiggle. Phase discrimination data are split (post hoc) into same-target-phase (open squares) and opposite-target-phase (crossed squares) trials. Phase affects both wiggle and threshold in a consistent way, so that data from both phases trace out the same curve. Phase discrimination threshold for an unflanked gabor (small open circle, on the far right of each graph) serves as a baseline for the flanked phase thresholds. Letter identification is done with a 10-letter alphabet (solid squares), but analyzing just the letter-I trials yields very similar contrast thresholds (small solid triangles), showing that the letter differences (“I” vs. others) do not affect the measured thresholds. Contrast thresholds for snake letters rotated 45 deg clockwise from vertical (small diamonds) are similar to those for upright letters (squares). Error bars are mean ± standard error of log thresholds. All points, except thresholds for letter identification in letter-I trials, have error bars, but the error bars are invisible when smaller than the symbol. The effect of wiggle up to 60 deg is monotonic. Beyond 60 deg, it varies among observers. In every observer, however, the effect of wiggle on each of the two tasks is a mirror image of the other. In the above plots, the data points in the 0 to 60 deg range of wiggle are left unconnected for unobstructed view of the quadratic fits (dashed). The data points beyond that range are connected by straight lines (solid).
Figure 5
Figure 5. Scatter plot of wiggle thresholds
Each point is the wiggle threshold W50 in the contour-integration task versus that in the crowding task. As predicted, the wiggle threshold is about 30 deg and the data points all lie practically on the line of equality. For each observer, we obtain four independent wiggle thresholds in the letter identification task and plot the mean (observer SBR orange diamond; LH green square; CRK purple circle). For each observer, we obtain two independent wiggle thresholds for the phase discrimination task and plot the mean. Error bars are mean ± standard error.
Figure 6
Figure 6. Crowding is unaffected by the spatial extent of the task-related information
The top panel displays the stimuli, which are presented in the periphery, 10 deg to the right of fixation. A: a single unflanked target gabor. B: a target gabor flanked by gabors, above and below, forming a vertical line. C: a target gabor flanked by eight gabors, forming three vertical lines. D: three target gabors in a vertical line, unflanked by other gabors. E: three target gabors flanked by two vertical lines of gabors. On a given trial, all gabors in the stimulus have one of three orientations relative to the vertical, 0, 45 or 90 deg, with the direction of tilt alternating between adjacent gabors. We add a small orientation jitter to each gabor, randomly chosen from a uniform distribution between -5 and 5 deg. The phase of each target gabor is random (ψ = 0 or 180 deg) on each trial. The non-target gabors have a phase of 0 deg. The wiggle is measured by the procedure described in Methods. For each configuration and wiggle, we present 40 trials. The stimulus is displayed for 150 ms. In both one-gabor-target and three-gabor-target conditions, after each trial, two response alternatives are presented on the screen. One is identical to the target and the other is a foil, identical to the target except that the phase of each gabor is random (0 or 180 deg), with the proviso that the foil is never wholly identical to the target. (The phase of more than one gabor can differ between target and foil when the target consists of several gabors.) The observer is asked to pick the alternative that matches the target. The bottom panel plots the (average) results of two observers. Performance in all conditions peaks at intermediate wiggles and declines at both higher and lower wiggles, just as observed in the main experiment. Chance performance (50%) is indicated by the dashed line. Error bars are mean ± standard error. To test whether there is an effect of the area occupied by the task-related information, we compare performance across the two main conditions (single- versus three-gabor target) in the cases that display the same number of gabors on the screen, i.e. B versus D (solid versus open circles) and C versus E (solid versus open squares). At each wiggle, performance is similar in these two conditions, showing no effect of tripling the number of gabors (and area) containing task-relevant information.
Figure 7
Figure 7. Livne and Sagi (2007) stimuli (A, B, C, D) with log threshold elevation (measured by them) and wiggle (measured by us)
Each stimulus consists of eight flanker gabors arranged in a circle around a target gabor. While fixating to the left or right of the stimulus, the task is to determine whether the central target is tilted clockwise or counterclockwise from horizontal. The configuration of the flankers was manipulated: A. all flankers group into a contour; B. the contour was interrupted at every other location; C. contour interrupted only at top and bottom; D. contour interrupted only at left and right. In these stimuli the target lies on a straight path with each pair of diametrically opposed gabors. We compute the wiggle of each of these gabor triplets in each of these configurations as a predictor of how well the target will bind with that pair of flankers. For each stimulus, we list the log threshold elevations and the lowest of the 4 wiggles. The two numbers reveal a reciprocal relation between log threshold elevation and minimum wiggle. Livne and Sagi proposed that grouping flankers into a contour reduces crowding. As predicted, configuration A does not show any crowding, and B does. We averaged the observers’ log threshold elevations for these configurations: with low contrast stimuli, average threshold elevation for A is 0.01±0.03 log units, and for B is 0.55±0.04 log units (n=2); threshold elevations for high contrast stimuli were similar (A 0.06±0.1, B 0.72±0.17; n=3). Their hypothesis predicts no difference in performance between configurations C and D. Our hypothesis is that the target is crowded whenever the target and flankers are grouped (aligned), regardless of grouping among flankers. Like theirs, our hypothesis correctly predicts much less crowding in A than in B. However, unlike theirs, our hypothesis predicts no crowding in C and strong crowding in D. In fact, this is what Livne and Sagi found (threshold elevation C 0.07±0.04, D 0.98±0.12; n=1). Furthermore, configuration D (although it is interrupted in only two locations) showed the highest threshold increase of all configurations. Our hypothesis predicts this as well, since the alignment of the target with flankers is best in this configuration.

Similar articles

Cited by

References

    1. Andriessen JJ, Bouma H. Eccentric vision: adverse interactions between line segments. Vision Research. 1976;16 (1):71– 78. - PubMed
    1. Appelle S. Perception and discrimination as a function of stimulus orientation: the “oblique effect” in man and animals. Psychological Bulletin. 1972;78 (4):266– 278. - PubMed
    1. Bouma H. Interaction effects in parafoveal letter recognition. Nature. 1970;226:177– 178. - PubMed
    1. Brainard DH. The Psychophysics Toolbox. Spatial Vision. 1997;10(4):433– 436. - PubMed
    1. Campbell FW, Kulikowski JJ, Levinson J. The effect of orientation on the visual resolution of gratings. Journal of Physiology. 1966;187 (2):427– 436. - PMC - PubMed

Publication types