. 2011 Sep;22(17):3263-75.
doi: 10.1091/mbc.E11-01-0020. Epub 2011 Jul 14.

RhoGDIα-dependent balance between RhoA and RhoC is a key regulator of cancer cell tumorigenesis

Affiliations

RhoGDIα-dependent balance between RhoA and RhoC is a key regulator of cancer cell tumorigenesis

T T Giang Ho et al. Mol Biol Cell. 2011 Sep.

Abstract

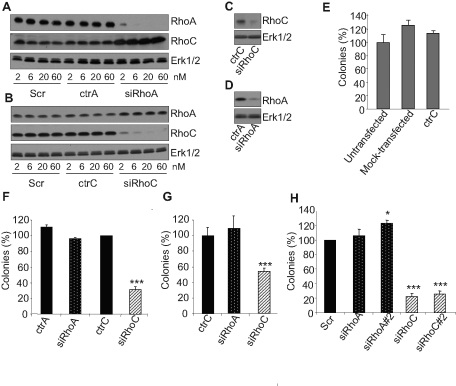
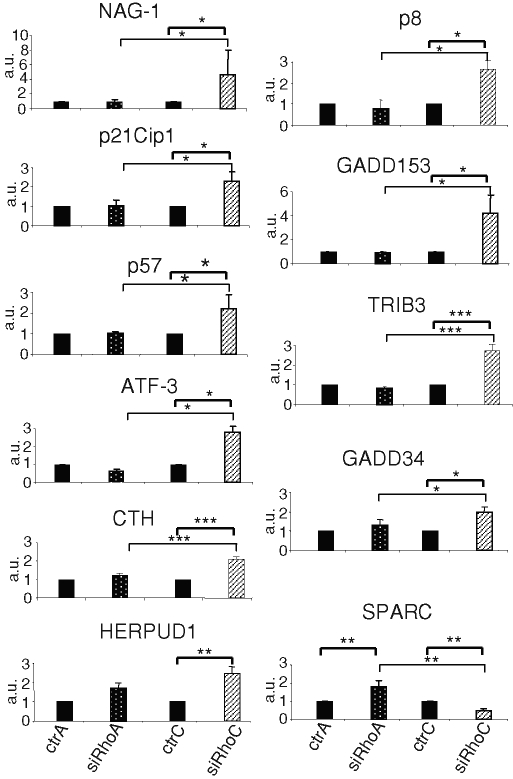
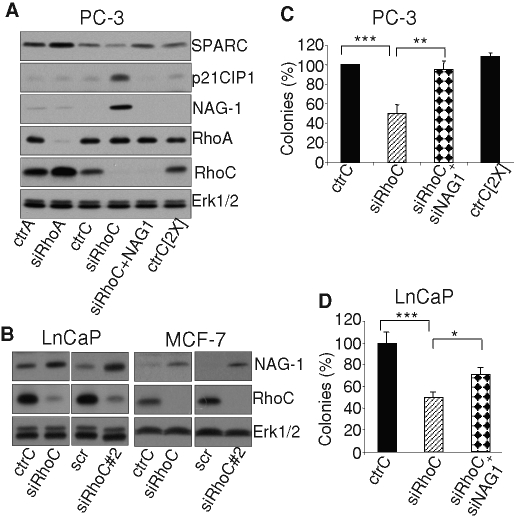
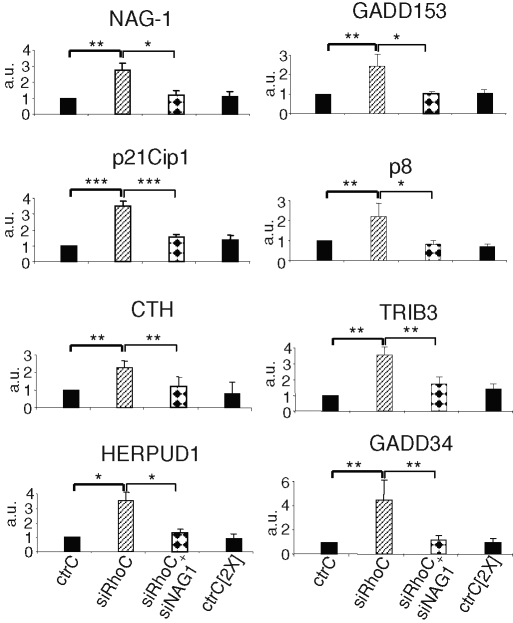
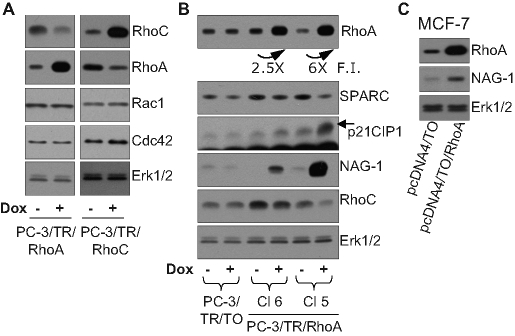
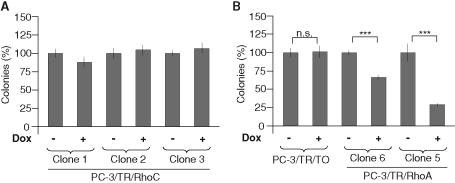
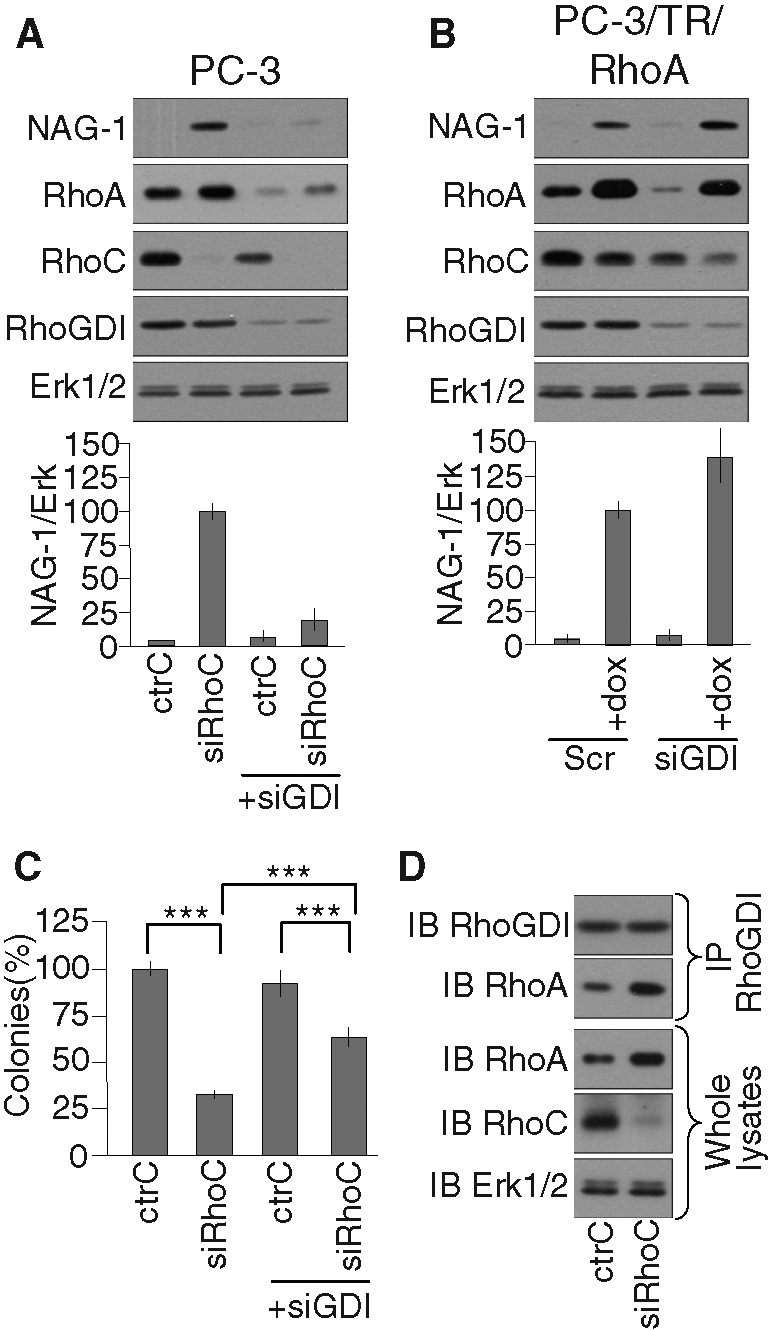
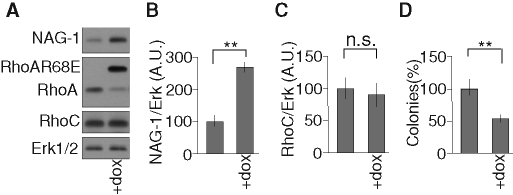
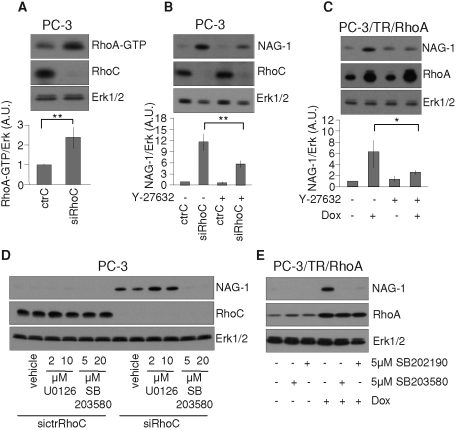
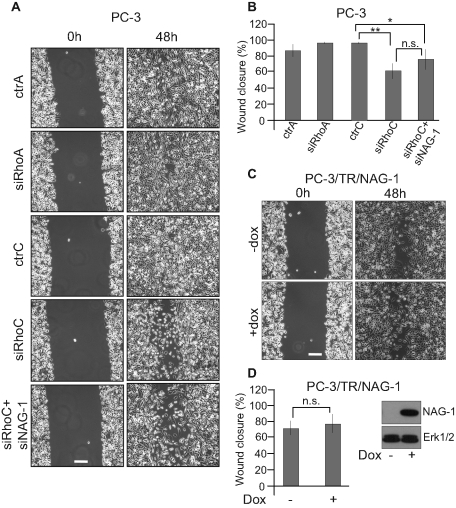
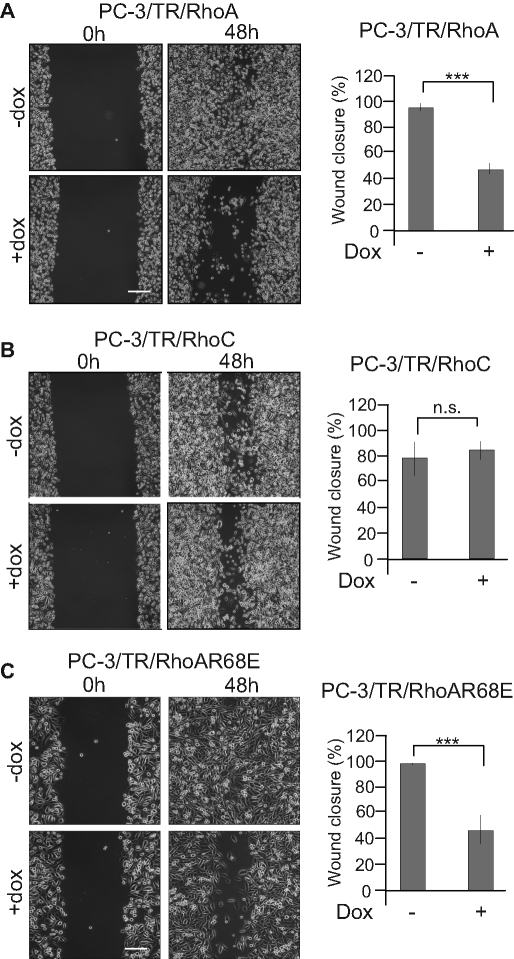
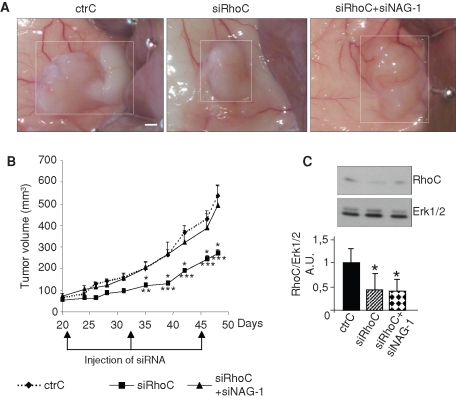
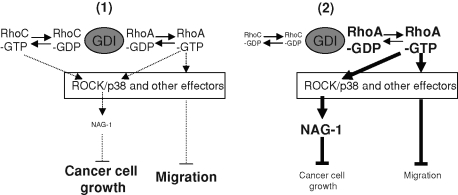
RhoGTPases are key signaling molecules regulating main cellular functions such as migration, proliferation, survival, and gene expression through interactions with various effectors. Within the RhoA-related subclass, RhoA and RhoC contribute to several steps of tumor growth, and the regulation of their expression affects cancer progression. Our aim is to investigate their respective contributions to the acquisition of an invasive phenotype by using models of reduced or forced expression. The silencing of RhoC, but not of RhoA, increased the expression of genes encoding tumor suppressors, such as nonsteroidal anti-inflammatory drug-activated gene 1 (NAG-1), and decreased migration and the anchorage-independent growth in vitro. In vivo, RhoC small interfering RNA (siRhoC) impaired tumor growth. Of interest, the simultaneous knockdown of RhoC and NAG-1 repressed most of the siRhoC-related effects, demonstrating the central role of NAG-1. In addition of being induced by RhoC silencing, NAG-1 was also largely up-regulated in cells overexpressing RhoA. The silencing of RhoGDP dissociation inhibitor α (RhoGDIα) and the overexpression of a RhoA mutant unable to bind RhoGDIα suggested that the effect of RhoC silencing is indirect and results from the up-regulation of the RhoA level through competition for RhoGDIα. This study demonstrates the dynamic balance inside the RhoGTPase network and illustrates its biological relevance in cancer progression.


Figures

FIGURE 1:
FIGURE 1:
Silencing RhoC but not RhoA repressed anchorage-independent growth. Increasing concentrations (2–60 nM) of Scr, ctrA, and siRhoA (A) or of Scr, ctrC, and siRhoC (B) were used to transfect PC-3 cells. At 48 h posttransfection, cells were lysed and analyzed by immunoblotting with specific antibodies to RhoA, RhoC, and Erk1/2. Strong and specific inhibitions of expression were observed with siRhoA and siRhoC at concentration as low as 2 nM. In sharp contrast, no effect was detected for the controls even at the highest concentrations. PC-3 cells were transfected with 20 nm of ctrC and siRhoC (C) or ctrA and siRhoA (D) and plated in soft agar as described in Materials and Methods. After 2 wk, cellular proteins were extracted and analyzed by immunoblotting with specific antibodies to RhoA, RhoC, and Erk1/2. siRhoA and siRhoC are still efficient after 2 wk of culture in soft-agar. PC-3 (E, F, and H) and LnCaP (G) transfected with 20 nM of the indicated siRNA were plated in soft agar as described in Materials and Methods. SiRhoA#2 and siRhoC#2 were designed and used to assess the specificity of the effects observed with siRhoA and siRhoC, respectively (H). After 2 wk of culture, colonies were counted in the whole-culture dishes. Three independent experiments were performed. Results are expressed in percentage of value obtained with untransfected cells (E), ctrC (F, G), or Scr (H). Only siRhoC is able to significantly reduce the number of colonies. *p < 0.05 and ***p < 0.001, analysis of variance (ANOVA), followed by Tukey–Kramer analysis.
FIGURE 2:
FIGURE 2:
Regulation of the expression of genes involved in growth arrest and of SPARC following RhoC or RhoA silencing. Real-time quantitative RT-PCR analysis was performed with total RNA purified from PC-3 cells 48 h after transfection with 20 nM of the various siRNA, either controls (ctrA and ctrC) or specific (siRhoA and siRhoC). Results are expressed as the mean ± SD of three independent experiments and confirms the microarray data reported in Table 1. *p < 0.05, **p < 0.01, ***p < 0.001, ANOVA, followed by Tukey–Kramer analysis.
FIGURE 3:
FIGURE 3:
(A, B) Western blot analyses of regulation induced by silencing RhoA or RhoC. (A) The regulation of NAG-1, p21Cip1, and SPARC expression was analyzed at the protein level. PC-3 cells were transfected with 20 nM of the indicated control and specific siRNA. At 48 h posttransfection, cells were lysed and analyzed by immunoblotting with specific antibodies to NAG-1, p21Cip1, SPARC, RhoA, RhoC, and Erk1/2. (B) The induction of NAG-1 was also observed in LnCaP and MCF-7 cells upon RhoC silencing by either siRhoC or siRhoC#2, again demonstrating that these regulations are not cell specific. At 48 h posttransfection, cells were lysed and analyzed by immunoblotting with specific antibodies to NAG-1, RhoC, and Erk1/2. (C, D) NAG-1 is involved in the regulation of anchorage-independent growth following RhoC silencing. (C) PC-3 cells or (D) LnCaP cells were transfected with 20 nM of the indicated control and specific siRNA. At 24 h after transfection cells were plated in soft agar as described in Materials and Methods. Results are reported as percentages of values obtained with the ctrC and are mean ± SD of three independent experiments. *p < 0.05, **p < 0.01, ***p< 0.001, ANOVA, followed by Tukey–Kramer analysis.
FIGURE 4:
FIGURE 4:
The up-regulation of the expression of several genes involved in growth arrest following RhoC silencing depends on NAG-1. Real-time quantitative PCR analysis of the expression of the indicated mRNA was performed with total RNA extracted from PC-3 cells 48 h after transfection with 20 nM (or 40 nM) of specific controls for siRhoC (ctrC or ctrC[2X]), with 20 nM of siRhoC, or with 20 nM siRhoC + 20 nM of siNAG-1 (siRhoC + siNAG1). Results are the mean ± SD of three independent experiments. *p < 0.05, **, p<0.01, ***p < 0.001, ANOVA, followed by Tukey–Kramer analysis.
FIGURE 5:
FIGURE 5:
(A) Cross-regulation of the levels of RhoA and RhoC was evaluated by using PC-3 clones overexpressing RhoA (PC-3/TR/RhoA; clone 5) or RhoC (PC-3/TR/RhoC; clone 1) in a doxycycline-dependent way in the presence (+dox) or absence of doxycycline. After 48 h of culture in these conditions, cells were lysed and analyzed by immunoblotting with specific antibodies to RhoA, RhoC, Rac1, Cdc42, and Erk1/2. Representative blots of at least three independent experiments are shown. (B, C) Regulation of gene expression by RhoA overexpression. (B) Two clones of PC-3 cells overexpressing RhoA in a doxycycline-dependent way (PC-3/TR/RhoA) and a control clone (PC-3/TR/TO) were used. Cells were supplemented or not with doxycycline (100 ng/ml). After 48 h of culture, cells were lysed and analyzed by immunoblotting with specific antibodies to SPARC, p21Cip1, NAG-1, RhoA, RhoC, and Erk1/2. (C) MCF-7 cells were transiently transfected with control vector (pcDNA4/TO) or with RhoA expression vector (pcDNA4/TO/RhoA). At 48 h after transfection, cells were lysed and analyzed with specific antibodies to NAG-1, RhoA, and Erk1/2. Representative blots of at least three independent experiments are shown.
FIGURE 6:
FIGURE 6:
Overexpression of RhoA, but not of RhoC, inhibits anchorage-independent growth. PC-3 clones overexpressing RhoC (A) or RhoA (B) and a control clone (PC-3/TR/T0) (B) were plated in soft agar as described in Materials and Methods. Cells were supplemented (+dox) or not with weekly renewed doxycycline (100 ng/ml). After 2 wk of culture, colonies were counted in the whole dishes. Results are reported on the unsupplemented condition and are expressed as mean ± SD. Representative results of three independent experiments are shown. ***p < 0.001, ANOVA, followed by Tukey–Kramer analysis.
FIGURE 7:
FIGURE 7:
(A, B) The induction of NAG-1 expression following RhoC silencing, but not following RhoA overexpression, depends on RhoGDIα. (A) PC-3 cells or (B) PC-3/TR/RhoA were transfected with 20 nM of the indicated control and specific siRNA. Cells were supplemented (+dox) or not with 100 ng/ml doxycycline for 48 h and processed for Western blot analysis with specific antibodies to NAG-1, RhoA, RhoC, RhoGDIα, and Erk1/2. Representative analyses are illustrated. Bottom, the mean ± SD of densitometric analysis of three independent experiments. (C) RhoGDIα contributes to the inhibition of anchorage-independent growth following RhoC silencing. PC-3 cells were transfected with 20 nM of the indicated control and specific siRNA. 24 h posttransfection, cells were plated in soft agar as described in Materials and Methods. After 2 wk of culture, colonies were counted in the whole dishes. Results are reported on the ctrC condition and are mean ± SD of three independent experiments. ***p < 0.001, ANOVA, followed by Tukey–Kramer analysis. (D) Increased RhoA-RhoGDIα association following RhoC silencing. At 48 h after transfection with 20 nM of the indicated siRNA, PC-3 cells were lysed. Clarified lysates were immunoprecipitated with specific antibodies to RhoGDIα. The whole lysates and the immunoprecipitates were subjected to Western blot analysis with specific antibodies to RhoA, RhoC, RhoGDIα, and Erk1/2. Representative analyses out of three independent experiments are shown.
FIGURE 8:
FIGURE 8:
The regulation of NAG-1 and the inhibition of anchorage-independent growth are mediated by the up-regulation of RhoA independent of the repression of RhoC expression. (A–C) PC-3/TR/RhoAR68E was supplemented (+dox) or not with 100 ng/ml doxycycline for 48 h and processed for Western blot analysis with specific antibodies to NAG-1, RhoA, RhoC, and Erk1/2. Representative analyses are illustrated. (B, C) The mean ± SD of densitometric analysis of three independent experiments. (D) PC-3/TR/RhoAR68E cells were plated in soft agar as described in Materials and Methods. Cells were supplemented (+dox) or not with weekly renewed doxycycline (100 ng/ml). After 2 wk of culture, colonies were counted in the whole dishes. Results are reported on the unsupplemented condition and are expressed as mean ± SD Representative results of three independent experiments are shown. **p < 0.01, ANOVA, followed by Tukey–Kramer analysis.
FIGURE 9:
FIGURE 9:
Regulation of NAG-1 depends on the RhoA–Rho kinase pathway and on p38MAPK but not on Erk1/2. (A) RhoC silencing increased RhoA activity. PC-3 cells were transfected with 20 nM of ctrC or with 20 nM of siRhoC. At 48h posttransfection, cells were harvested and processed for Western blot and pull-down experiments. An aliquot of each lysate was denatured in SDS–PAGE loading buffer to analyze the concentration of RhoC and Erk1/2 with specific antibodies. RhoA activity was determined as the amount of GST-RBD–bound RhoA (RhoA-GTP) normalized to Erk1/2 in whole-cell lysates. (B) PC-3 cells were transfected with 20 nM of ctrC or siRhoC and then treated or not with Y-27632 (10 µM) during 48 h. (C) PC-3/TR/RhoA cells were treated or not with doxycycline (100 ng/ml) and with Y-27632 (10 μM) or the vehicle alone during 48 h. (D) PC-3 cells were transfected with 20 nM of ctrC or siRhoC and then treated or not with the indicated concentrations of U0126 or SB203580 or vehicle alone during 48 h. (E)PC-3/TR/RhoA cells were treated or not with doxycycline (100 ng/ml) and with indicated concentration of SB203580 or SB202190 or vehicle alone during 48 h. Cells were lysed and analyzed by immunoblotting with specific antibodies to NAG-1, RhoA, RhoC, and Erk1/2. Representative blots of at least three independent experiments are shown. *p < 0.05, **p < 0.01, ANOVA, followed by Tukey–Kramer analysis.
FIGURE 10:
FIGURE 10:
Silencing RhoC but not RhoA inhibited PC-3 cell migration independent of NAG-1. (A) PC-3 cells were transfected with 20 nM of ctrA, siRhoA, ctrC, or siRhoC or 20 nM siRhoC + 20 nM of siNAG-1. Immediately after transfection, cells were seeded in six-well plates. Twenty-four hours later, the monolayers were scratched. Phase-contrast microscopy photographs were taken immediately after wounding (0 h) and 48 h after wounding (48h). (B, D) Quantification of wound closure. The mean ± SD of at least four independent experiments. (C) PC-3/TR/NAG-1 cells were seeded in six-well plates. Twenty-four hours later, the monolayers were scratched and treated (+dox) or not (–dox) with 100 ng/ml doxycycline. Phase-contrast microscopy photographs were taken immediately after wounding (0 h) and 48 h after wounding (48 h). Bar, 250 μm. n.s., not significant; *p < 0.05, **p < 0.01, ANOVA, followed by Tukey–Kramer analysis.
FIGURE 11:
FIGURE 11:
PC-3 cell migration is inhibited by the up-regulation of RhoA independent of the repression of RhoC expression. Confluent monolayers of PC-3/TR/RhoA (A), PC-3/TR/RhoC (B), or PC-3/TR/RhoAR68E (C) cells were scratched and treated (+dox) or not (−dox) with 100 ng/ml doxycycline. Phase-contrast microscopy photographs were taken immediately after wounding (0 h) and 48 h after wounding (48 h). Right, quantification of wound closure. The results are expressed as mean ± SD of at least four independent experiments. Bar, 250 μm. ***p < 0.001, ANOVA, followed by Tukey–Kramer analysis.
FIGURE 12:
FIGURE 12:
The in vivo antitumorigenic effect of the siRNA targeting RhoC is inhibited by coadministration of siRNA targeting NAG-1. After induction of tumor formation by subcutaneous injection of 2 × 10⁶ PC-3 cells, 50 μl of a solution containing 10 μM of a specific control for siRhoC (ctrC), 10 μM of the first siRNA targeting RhoC (siRhoC), or 10 μM of the first siRNA targeting RhoC + 10 μM of the siRNA targeting NAG-1 (siRhoC + siNAG1) mixed with atelocollagen as described in Materials and Methods was injected into the tumor region on days 21, 33, and 45. (A) Representative tumors photographed after sacrifice of the mice at day 48. (B) Tumor volume was calculated from tumor biaxial diameter measurement at regular interval up to day 48. Results represent the means ± SEM (n = 12 tumors). *p < 0.05, **p < 0.01, ***p < 0.001, ANOVA, followed by Tukey–Kramer analysis.
FIGURE 13:
FIGURE 13:
Schematic overview of the RhoGDIα-mediated balance between RhoA and RhoC, resulting in modifications of the signaling pathway and leading to cancer cell growth and migration. (1) In basal condition, the activation of RhoA and RhoC is not sufficient to induce NAG-1 expression via ROCK. Cancer cells proliferate and migrate efficiently. (2) On RhoC silencing, the amount of RhoA-GDP stabilized by RhoGDIα and available for activation by specific GEF is increased. This leads to an enhanced level of RhoA-GTP, which drives NAG-1 gene expression via ROCK. RhoA overexpression induces a similar phenotype. The shift of the balance toward RhoA also inhibits cell migration but through an NAG-1–independent pathway.

References

    1. Bauskin AR, Brown DA, Kuffner T, Johnen H, Luo XW, Hunter M, Breit SN. Role of macrophage inhibitory cytokine-1 in tumorigenesis and diagnosis of cancer. Cancer Res. 2006;66:4983–4986. - PubMed
    1. Bellovin DI, Simpson KJ, Danilov T, Maynard E, Rimm DL, Oettgen P, Mercurio AM. Reciprocal regulation of RhoA and RhoC characterizes the EMT and identifies RhoC as a prognostic marker of colon carcinoma. Oncogene. 2006;25:6959–6967. - PubMed
    1. Berenjeno IM, Nunez F, Bustelo XR. Transcriptomal profiling of the cellular transformation induced by Rho subfamily GTPases. Oncogene. 2007;26:4295–4305. - PMC - PubMed
    1. Bielek H, Anselmo A, Dermardirossian C. Morphological and proliferative abnormalities in renal mesangial cells lacking RhoGDI. Cell Signal. 2009;21:1974–1983. - PMC - PubMed
    1. Boulter E, Garcia-Mata R, Guilluy C, Dubash A, Rossi G, Brennwald PJ, Burridge K. Regulation of Rho GTPase crosstalk, degradation and activity by RhoGDI1. Nat Cell Biol. 2010;12:477–483. - PMC - PubMed

Publication types

MeSH terms

Substances