. 2011 Aug 2;108(31):12845-50.
doi: 10.1073/pnas.1109632108. Epub 2011 Jul 14.

Asymmetric cancer cell division regulated by AKT

Affiliations

Asymmetric cancer cell division regulated by AKT

Ipsita Dey-Guha et al. Proc Natl Acad Sci U S A. .

Abstract

Human tumors often contain slowly proliferating cancer cells that resist treatment, but we do not know precisely how these cells arise. We show that rapidly proliferating cancer cells can divide asymmetrically to produce slowly proliferating "G0-like" progeny that are enriched following chemotherapy in breast cancer patients. Asymmetric cancer cell division results from asymmetric suppression of AKT/PKB kinase signaling in one daughter cell during telophase of mitosis. Moreover, inhibition of AKT signaling with small-molecule drugs can induce asymmetric cancer cell division and the production of slow proliferators. Cancer cells therefore appear to continuously flux between symmetric and asymmetric division depending on the precise state of their AKT signaling network. This model may have significant implications for understanding how tumors grow, evade treatment, and recur.


Conflict of interest statement

The authors declare no conflict of interest.

Figures
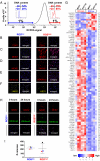
Fig. 1.
Fig. 1.
Slowly cycling G0-like cancer cells in vitro. (A) FACS analysis of MCF7 cells with gates for sorting ROSlow (blue) and ROShigh (red) cells. Insets show cell-cycle profiles of ROSlow and ROShigh populations. Tables indicate percentage of cells with respective DNA contents. (BF) Cytospin of cells sorted for high or low ROS staining and stained for (B) ESR1, (C) MKI67, (D) MCM2, (E) H3K9me2, and (F) HES1. Merged images represent respective stains merged with underlying DAPI stain. (G) Heatmap of transcriptional profiles of three independent replicates of ROS-sorted MCF7 and HCT116 cells (columns). Rows depict expression of genes with greater than twofold change in expression and FDR < 0.25. Numbers on the right indicate fold change. Colorgram depicts high (red) and low (blue) relative levels of gene expression. (H) ROS-sorted cells stained for MKI67 and H3K9me2 either as cytospins (0 h) or after 24 h of culture. Merged images represent respective stains merged with underlying DAPI stain. (I) Plot shows number of colonies from MCF7, ROSlow, or ROShigh from three independent experiments (each symbol represents one independent experiment). Error bars indicate SD. me2, dimethyl.
Fig. 2.
Fig. 2.
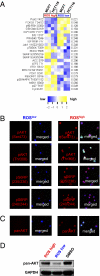
Molecular profiling of G0-like cells. (A) Heatmap of proteomic profiles of two independent replicates of ROS-sorted MCF7 and HCT116 cells (columns). Rows represent proteins with significant change in expression (FDR < 0.25). Numbers on the right indicate FDR. Colorgram depicts high (yellow) and low (blue) relative levels of proteins. (B and C) Cytospins of ROS-sorted cells stained for (B) pAKT (Ser473), pAKT (Thr308), pS6RP (235/236), and pS6RP (240/244) and (C) pan-AKT. (D) Western blot for pan-AKT on bulk and ROS-sorted MCF7 cells. p, phosphorylated.
Fig. 3.
Fig. 3.
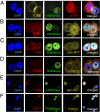
G0-like cancer cells arise through asymmetric division. (AD) MCF7 cells in telophase stained for DAPI, β-tubulin (TUBB), (A) AKT1-mCherry cells, asymmetric, (B) pan-AKT, asymmetric, (C) pan-AKT, symmetric, and (D) HES1, asymmetric. (E and F) MCF7 cells in interphase stained for (E) DAPI, β-tubulin, H3K9me2, and pan-AKT and (F) DAPI, HES1, H3K9me2, and FOXO1.
Fig. 4.
Fig. 4.
Induction of asymmetric cancer cell division with AKT inhibition. (A) Titration curve of MCF7 cells treated with different doses of AKT-1/2i. (B) Western blot of MCF7 cells treated with different doses of AKT-1/2i for pAKT (Thr308) and pS6RP (Ser235/236). (C) Cells treated with DMSO or AKT-1/2i for 3 d at 2 μM concentration or treated with AKT-1/2i for 3 d followed by 6 d of washout (AKT-1/2i -6dwash) and stained for MCM2, H3K9me2, and HES1. (D and E) Cells treated with DMSO or AKT-1/2i for 3 d at 2 μM concentration and counted for (D) G0-like cells or (E) asymmetric cells. (F) Colony formation of MCF7 cells after 6 d of AKT-1/2i or DMSO followed by 12 d of washout. Red and blue columns indicate control (DMSO) and AKT-1/2i-treated, respectively. Error bars indicate mean ± SD. (G) Percentage of MCF7 cell-cycle times <t for DMSO (red) versus 2 μM AKT-1/2i (blue) -treated cells. Cells were grown in DMEM + 10% FCS for 1 d before being treated with either 1:1,000 DMSO or 2 μM AKT-1/2i at t = 0, with washout at t = 5 d. Events were recorded by tracking the length of the first two complete cell-cycle divisions after t = 0. Cell events in the AKT-1/2i group were discounted if exposure to AKT-1/2i was <24 h before washout. n = 483 and 825 for DMSO- and AKT-1/2i-treated cells, respectively. (H) Percentage of sibling pairs with cell-cycle times <t for DMSO (red) versus 2 μM AKT-1/2i (blue) -treated cells. Treatment protocol is the same as in G. n = 221 and 326 for DMSO- and AKT-1/2i-treated cells, respectively. (I) Percentage of sibling pairs with cell-cycle time differences <t for cells initially exposed to 2 μM AKT-1/2i within 6 h after mitosis (red; n = 41), between 6 and 12 h after mitosis (light red; n = 55), between 6 and 12 h before mitosis (light blue; n = 46), and within 6 h before mitosis (blue; n = 34).
Fig. 5.
Fig. 5.
G0-like cells enriched after treatment in vivo. Human breast tumor samples from five different patients were stained for H3K9me2, MCM2, HES1, pan-AKT, and cytokeratin. G0-like cytokeratin-positive cells (defined as H3K9me2low/MCM2low, H3K9me2low/HES1high, or H3K9me2low/pan-AKTlow) before and after chemotherapy were counted. (A and B) Human breast tumor from patient 1 stained for DAPI (blue), dimethyl-H3K9 (green), human cytokeratin (yellow), and pan-AKT (red) (A) before (pretreatment) and (B) after (posttreatment) chemotherapy. The arrow points to G0-like cells. (CE) Bar graph of percentages of H3K9me2low/MCM2low, H3K9me2low/HES1high, and H3K9me2low/pan-AKTlow cytokeratin-positive cells before (red) and after (blue) chemotherapy for the five patients.

References

    1. Nowell PC. The clonal evolution of tumor cell populations. Science. 1976;194:23–28. - PubMed
    1. Loddo M, et al. Cell-cycle-phase progression analysis identifies unique phenotypes of major prognostic and predictive significance in breast cancer. Br J Cancer. 2009;100:959–970. - PMC - PubMed
    1. Massagué J. G1 cell-cycle control and cancer. Nature. 2004;432:298–306. - PubMed
    1. Coser KR, et al. Antiestrogen-resistant subclones of MCF-7 human breast cancer cells are derived from a common monoclonal drug-resistant progenitor. Proc Natl Acad Sci USA. 2009;106:14536–14541. - PMC - PubMed
    1. Diehn M, et al. Association of reactive oxygen species levels and radioresistance in cancer stem cells. Nature. 2009;458:780–783. - PMC - PubMed

Publication types

MeSH terms

Associated data