Comparative Study
. 2011 Sep 2;109(6):658-69.
doi: 10.1161/CIRCRESAHA.111.248260. Epub 2011 Jul 14.

Haploinsufficiency of target of rapamycin attenuates cardiomyopathies in adult zebrafish

Affiliations
Comparative Study

Haploinsufficiency of target of rapamycin attenuates cardiomyopathies in adult zebrafish

Yonghe Ding et al. Circ Res. .

Abstract

Rationale: Although a cardioprotective function of target of rapamycin (TOR) signaling inhibition has been suggested by pharmacological studies using rapamycin, genetic evidences are still lacking. We explored adult zebrafish as a novel vertebrate model for dissecting signaling pathways in cardiomyopathy.

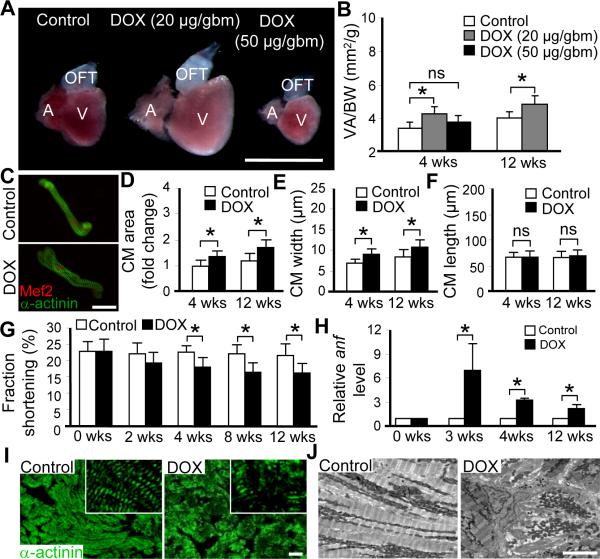
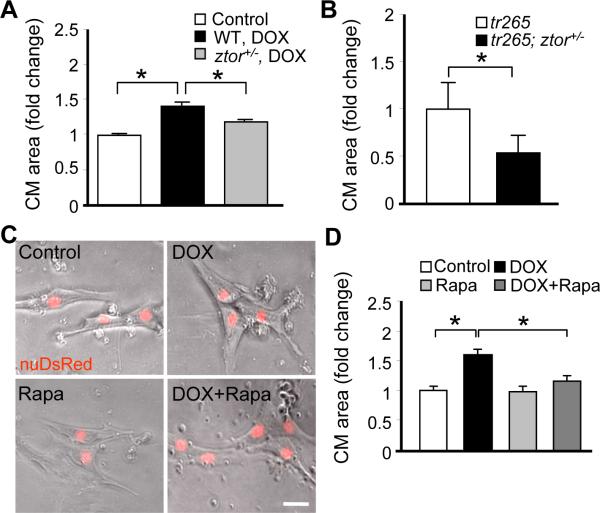
Objective: We generated the second adult zebrafish cardiomyopathy model induced by doxorubicin. By genetically analyzing both the doxorubicin and our previous established anemia-induced cardiomyopathy models, we decipher the functions of TOR signaling in cardiomyopathies of different etiology.

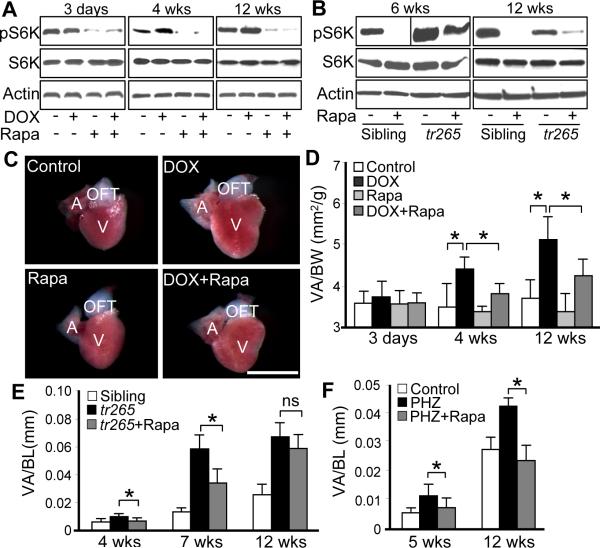
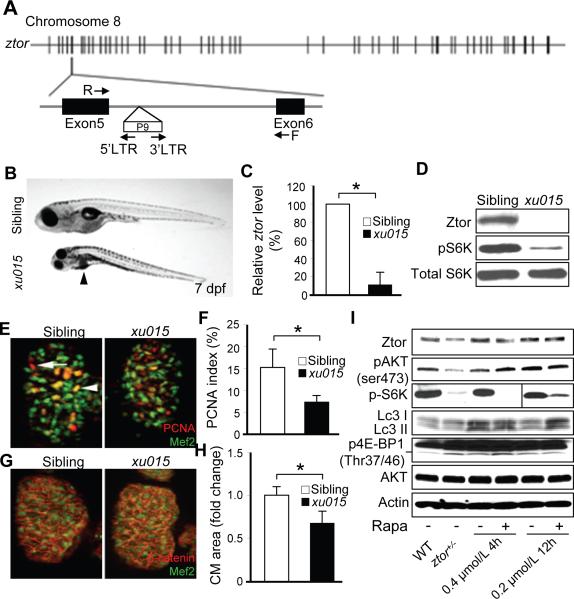
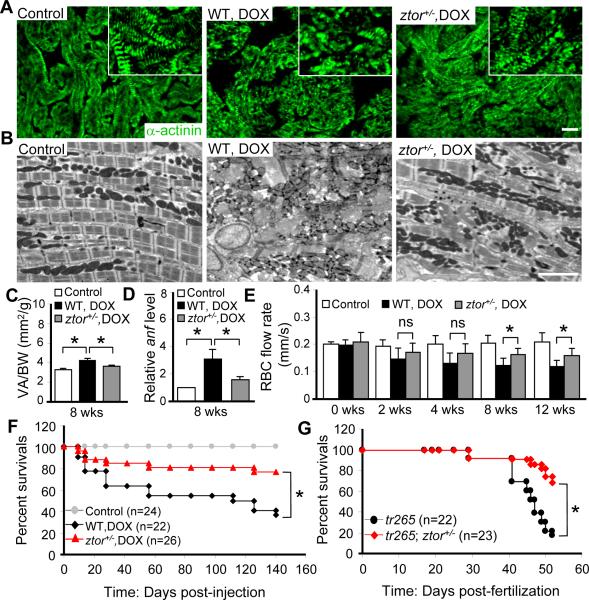
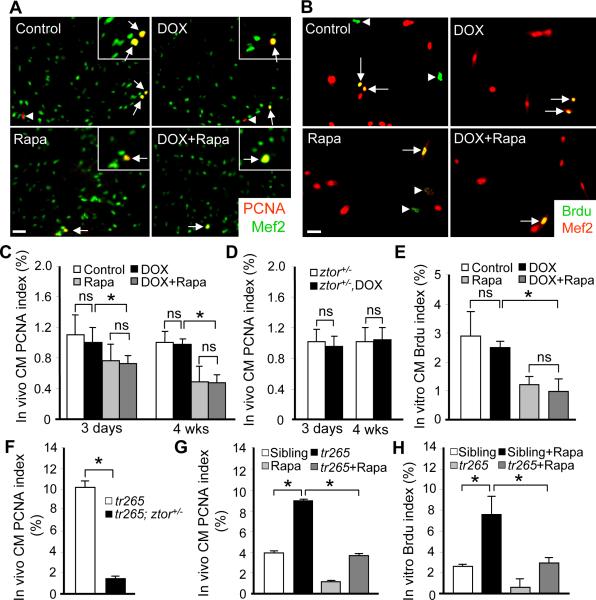
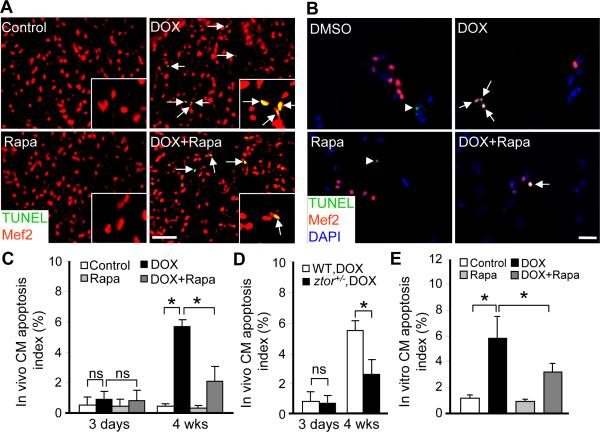
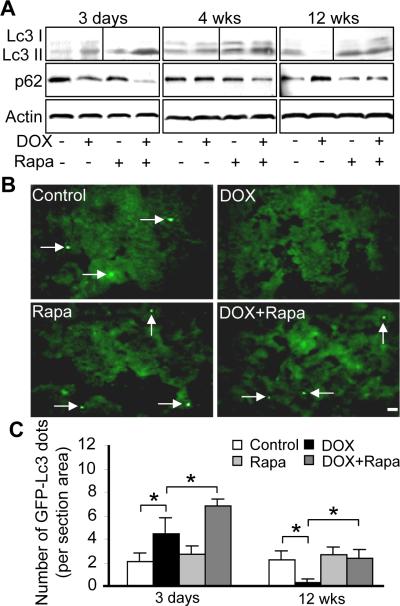
Methods and results: Along the progression of both cardiomyopathy models, we detected dynamic TOR activity at different stages of pathogenesis as well as distinct effects of TOR signaling inhibition. Nevertheless, cardiac enlargement in both models can be effectively attenuated by inhibition of TOR signaling through short-term rapamycin treatment. To assess the long-term effects of TOR reduction, we used a zebrafish target of rapamycin (ztor) mutant identified from an insertional mutagenesis screen. We show that TOR haploinsufficiency in the ztor heterozygous fish improved cardiac function, prevented pathological remodeling events, and ultimately reduced mortality in both adult fish models of cardiomyopathy. Mechanistically, these cardioprotective effects are conveyed by the antihypertrophy, antiapoptosis, and proautophagy function of TOR signaling inhibition.

Conclusions: Our results prove adult zebrafish as a conserved novel vertebrate model for human cardiomyopathies. Moreover, we provide the first genetic evidence to demonstrate a long-term cardioprotective effect of TOR signaling inhibition on at least 2 cardiomyopathies of distinct etiology, despite dynamic TOR activities during their pathogenesis.


Figures

Figure 1
Figure 1. DOX-induced cardiomyopathy in zebrafish
A, Representative images of dissected hearts from casper fish at 4 weeks post-injection with low (20 μg/gbm) or high (50 μg/gbm) dose of doxorubicin (DOX). Scale bar=1 mm. B, Quantification of the ventricle area to body weight index (VA/BW) showed heart enlargement at both 4 and 12 weeks post-DOX (20 μg/gbm) injection. C, Representative images of single cardiomyocyte (CM) dissociated from fish hearts at 12 weeks post-DOX (20 μg/gbm) injection. CMs were co-stained with α-actinin and Mef2. Scale bar=20 μm. D, Quantification of CM area to show that CM size was increased in fish hearts at both 4 and 12 weeks post-DOX (20 μg/gbm) injection, which could be explained by increased CM width (E), but not CM length (F). G, Time courses of fraction shortening (FS) measuring using casper;Tg(cmlc2:nuDsRed) fish after 20 μg/gbm DOX injection. Significantly decreased FS was detected at 4 weeks and thereafter post-DOX injection. H, Quantitative RT-PCR showing re-activated expression of atrial natriuretic factor (anf) in 20 μg/gbm DOX-induced cardiac remodeling process. I, α-actinin antibody staining to show muscular disarray at 12 weeks post 20 μg/gbm DOX injection. Insets are images of higher magnification. Scale bar=20 μm. J, Transmission electron microscopy (TEM) verified muscular disarray and myofibril loss in fish hearts at 6 months post 20 μg/gbm DOX injection. Scale bar=5 μm. V, ventricle; A, atrium; OFT, outflow tract. *P<0.05.
Figure 2
Figure 2. Effects of rapamycin on cardiac enlargement induced by either DOX or anemia
A, TOR activity dynamics in fish hearts injected with DOX (20 μg/gbm) with or without rapamycin (0.2 μmol/L) treatment. B, TOR activity in fish hearts dissected from tr265 sibling and tr265 homozygous mutant with or without rapamycin (0.4 μmol/L) treatment. C, Representative images of dissected fish hearts at week 4 post-DOX (20 μg/gbm) injection with or without rapamycin (0.2 μmol/L) treatment. Scale bar=1 mm. D, Quantification of ventricle area to body weight index (VA/BW) at different time points post-DOX injection with or without rapamycin (0.2 μmol/L) treatment. E, Quantification of VA/BW index at different ages of tr265 fish compared to sibling with or without rapamycin (0.4 μmol/L) treatment. F, Quantification of VA/BW index to show one-week rapamycin (0.4 μmol/L) treatment attenuates phenylhydrazine (PHZ) induced heart enlargement at both 5 weeks and 12 weeks old fish. *P<0.05. ns, not significant. V, ventricle; A, atrium; OFT, outflow tract.
Figure 3
Figure 3. Isolation of a zebrafish target of rapamycin hypomorphic mutant: ztorxu015
A, A P9 insertion was inserted within the 5th intron of the zebrafish target of rapamycin (ztor) gene at chromosome 8 in the ztorxu015 mutant. Locations of the primers used in LM-PCR and genotyping are indicated by arrows. B, The homozygous ztorxu015 mutant (ztor−/−) embryos appeared to be smaller compared to their normal siblings and displayed dark liver phenotypes at 7 days post-fertilization (dpf). Arrowheads indicate location of the liver. C, Quantificative RT-PCR revealed that the mRNA level of ztor was reduced by about 90% in the ztor−/− compared to that in normal siblings at 7 dpf. D, Western blot analysis confirmed a dramatic reduction of Ztor protein in the ztor−/− mutant at 7 dpf. In addition, phosphor-ribosomal S6K was also dramatically reduced, while the total ribosomal S6K level remained unchanged in the ztor−/− mutant. E, Representative images of dissected fish hearts at 7 dpf after co-immunostained with Mef2 (green) to label CMs and PCNA (red) to label proliferative cells. Scale bar=10 μm. Arrowhead indicates a proliferating CM. Arrow indicates a proliferating non-CM. F, Quantification of CM proliferation index represented in (E). G, Representative images of dissected fish hearts at 7 dpf after co-immunostained with Mef2 (green) and β-catenin (red) to define borders of CMs. H, Quantification of CM cell size represented in (G). I, Expression levels of total Ztor protein and its downstream branches of TORC1 and TORC2 in 6-month old ztorxu015 heterozygous fish (ztor+/−) compared to that in wild type siblings treated with or without rapamycin (0.4 μmol/L 4 h daily or 0.2 μmol/L 12 h daily for consecutive 7 days). p4E-BP1 level is indicated by the lower band. *P<0.05.
Figure 4
Figure 4. TOR haploinsufficiency attenuates DOX or anemia-induced cardiomyopathy
A, α-actinin antibody staining showing attenuated muscular disarray detected in the ztor+/− fish ventricle compared to that in wild type control at week 12 after 20 ug/gbm DOX injection. Insets are images of higher magnification. Scale bar=20 μm. B, Transmission electron microscopy (TEM) showing attenuated muscular disarray and myofibril loss detected in the ztor+/− fish ventricle compared to that in wild type control at 6 months after 20 μg/gbm DOX injection. Scale bar=5 μm. C, Quantification data to show ztor+/− fish had significantly attenuated ventricular enlargement compared to that in wild type control at week 8 after 20 μg/gbm DOX injection. D, Evaluation of fetal gene expression by quantitative RT-PCR. anf expression was reduced in the ztor+/− heart compared to that in wild type control at week 12 after 20 μg/gbm DOX injection. E, Evaluation of cardiac function by quantifying the red blood cell (RBC) flow rate. The ztor+/− fish exhibited improved RBC flow rate compared to that in wild type control treated with 20 μg/gbm DOX since week 8. F, Kaplan-Meier survival curves of the ztor+/− and wild type fish treated with 20 μg/gbm DOX vs. untreated wild type control. G, Kaplan-Meier survival curves of the tr265; ztor+/− fish compared to that in the tr265. *P<0.05. ns, not significant.
Figure 5
Figure 5. TOR signaling inhibition attenuates cardiomyocyte hypertrophy
A, Quantification data to show ztor+/− fish had significantly attenuated CM cell size compared to that in wild type control at week 8 after 20 μg/gbm DOX injection. B, Quantification data to show tr265; ztor+/− fish had significantly attenuated CM cell size compared to that in tr265 fish at 6 weeks old age. C, Representative images of primary cultured CMs treated with 2 h of DOX (5 μmol/L) with or without rapamycin (0.2 μmol/L) co-treatment. Scale bar=20 μm. D, Quantification of CM cell size to show that DOX-induced cellular hypertrophy was attenuated by rapamycin co-treatment. *P<0.05.
Figure 6
Figure 6. Effects of DOX and TOR inhibition on myocyte proliferation
A, Merged images of sectioned fish ventricles co-stained with PCNA (red) and Mef2 (green) at 4 weeks after 20 ug/gbm DOX injection with or without rapamycin (0.2 μmol/L) treatment. Insets are images of higher magnification. Arrows: PCNA+/Mef2+ cells; Arrowheads: PCNA+/Mef2-cells. Scale bar=20 μm. B, Merged images of primary cultured CMs co-stained with BrdU (green) and Mef2 (red) after 2 h of DOX treatment (5 μmol/L) with or without rapamycin (0.2 μmol/L) co-treatment. Scale bar=20 μm. Arrows: BrdU+/Mef2+ cells; arrowheads: BrdU+/Mef2-cells. C, Quantification of the PCNA index in fish heart represented in (A). D, Quantification of PCNA index in the sectioned ventricles of ztor+/− fish with or without DOX injection at both 3 days and 4 weeks time points. E, Quantification of the BrdU index from primary cultured CMs represented in (B). F, Evaluation of hyperplasia by quantifying CM PCNA index in sectioned hearts represented in tr265; ztor+/− compared to that in tr265. G, Quantification of PCNA index in tr265 fish with or without rapamycin (0.4 μmol/L) treatment at 6 weeks old age. H, Quantification of primary cultured Brdu index in tr265 fish with or without rapamycin (0.4 μmol/L) treatment in vitro. *P<0.05. ns, not significant.
Figure 7
Figure 7. Effects of TOR inhibition on cardiomyocyte apoptosis
A, Merged images of sectioned fish ventricles co-stained with TUNEL (green) and Mef2 (red) at 4 weeks after 20 ug/gbm DOX injection with or without rapamycin (0.2 μmol/L) treatment. Insets are images of higher magnification. Arrows: Mef2+/TUNEL+ cells. Scale bar=20 μm. B, Merged images of primary cultured CMs co-stained with TUNEL (green), Mef2 (red) and DAPI (blue) after 2 h of DOX (5 μmol/L) treatment with or without rapamycin (0.2 μmol/L) co-treatment. Arrows: TUNEL+/Mef2+ cells; arrowheads: TUNEL+/Mef2-cells. Scale bar=20 μm. C, Quantification of apoptotic cells in sectioned ventricles to show dramatically increased apoptosis at 4 weeks, but not 3 days after 20 μg/gbm DOX injection, and rapamycin attenuates 20 μg/gbm DOX-induced apoptosis significantly. D, Quantification of apoptotic cells in sectioned ventricles to show significantly reduced apoptosis was observed in ztor+/− fish compared to that in wild type fish at 4 weeks, but not 3 days after 20 μg/gbm DOX injection. E, Quantification of the TUNEL index from (B) showed that 5 μmol/L DOX induced significant apoptosis in primary cultured CMs and that rapamycin was able to inhibit DOX-induced apoptosis in vitro. *P<0.05. ns, not significant.
Figure 8
Figure 8. Opposite autophagy activities at early and later stages post-DOX injection
A, Shown are western blotting to assess the autophagy activity dynamics in fish hearts injected with DOX (20 μg/gbm) with or without rapamycin (0.2 μmol/L) treatment, as indicated by both Lc3 conversion and p62 degradation. B, Represented images of sectioned ventricles of Tg(GFP-Lc3) fish at 12 weeks after 20 μg/gbm DOX injection with or without rapamycin (0.2 μmol/L) treatment. Arrows: Lc3 aggregating dots formed during autophagy. C, Quantification of GFP-Lc3 aggregation dots in fish ventricles at 3 days and 12 weeks after 20 μg/gbm DOX injection with or without rapamycin (0.2 μmol/L) treatment. *P<0.05.

References

    1. Shin JT, Fishman MC. From Zebrafish to human: modular medical models. Annu Rev Genomics Hum Genet. 2002;3:311–340. - PubMed
    1. Sun X, Hoage T, Bai P, Ding Y, Chen Z, Zhang R, Huang W, Jahangir A, Paw B, Li YG, Xu X. Cardiac hypertrophy involves both myocyte hypertrophy and hyperplasia in anemic zebrafish. PLoS One. 2009;4:e6596. - PMC - PubMed
    1. Paw BH, Davidson AJ, Zhou Y, Li R, Pratt SJ, Lee C, Trede NS, Brownlie A, Donovan A, Liao EC, Ziai JM, Drejer AH, Guo W, Kim CH, Gwynn B, Peters LL, Chernova MN, Alper SL, Zapata A, Wickramasinghe SN, Lee MJ, Lux SE, Fritz A, Postlethwait JH, Zon LI. Cell-specific mitotic defect and dyserythropoiesis associated with erythroid band 3 deficiency. Nat Genet. 2003;34:59–64. - PubMed
    1. Christiansen S, Autschbach R. Doxorubicin in experimental and clinical heart failure. Eur J Cardiothorac Surg. 2006;30:611–616. - PubMed
    1. Robert J. Preclinical assessment of anthracycline cardiotoxicity in laboratory animals: predictiveness and pitfalls. Cell Biol Toxicol. 2007;23:27–37. - PubMed

Publication types

MeSH terms

Substances