. 2011 Sep 2;286(35):30504-30512.
doi: 10.1074/jbc.M111.264721. Epub 2011 Jul 7.

The histone chaperone facilitates chromatin transcription (FACT) protein maintains normal replication fork rates

Affiliations

The histone chaperone facilitates chromatin transcription (FACT) protein maintains normal replication fork rates

Takuya Abe et al. J Biol Chem. .

Abstract

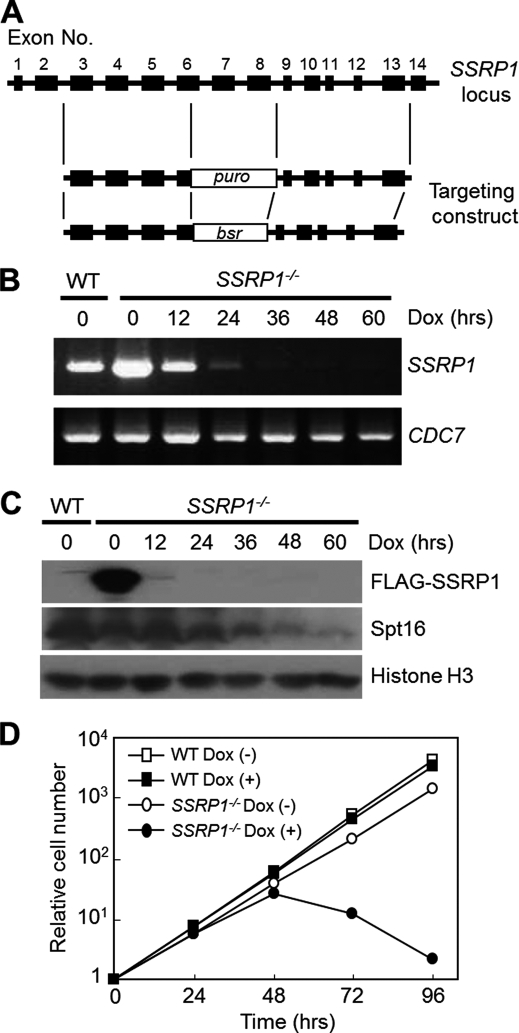
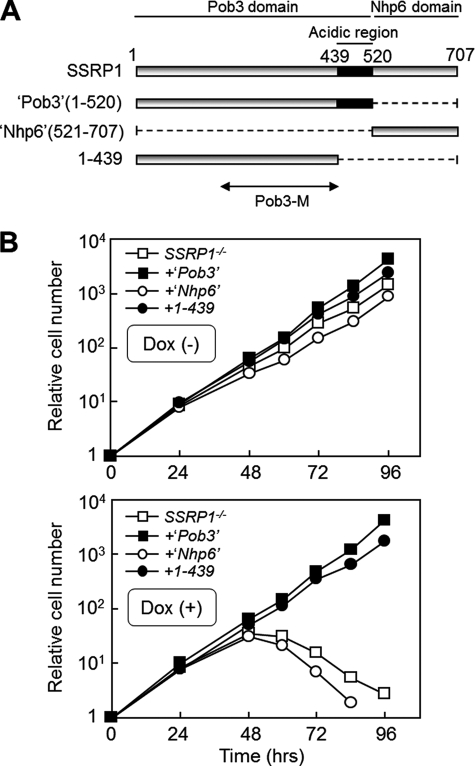
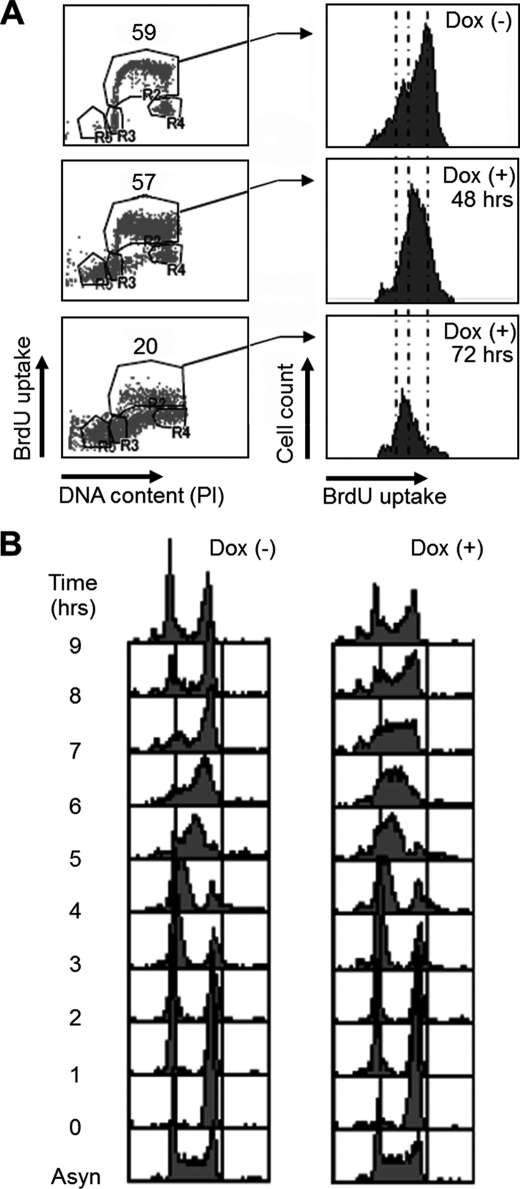
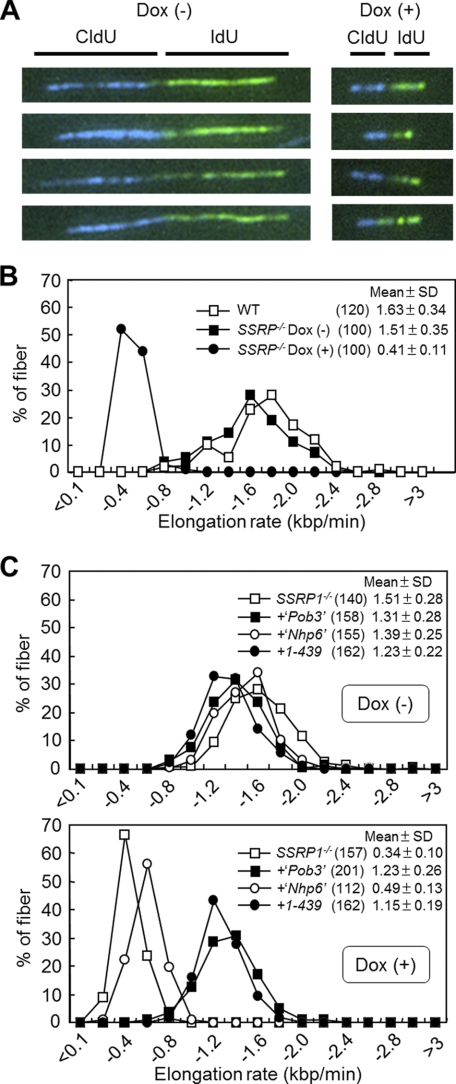
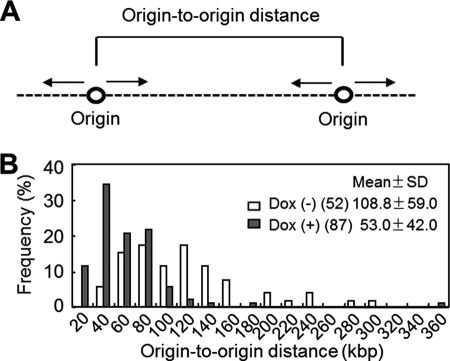
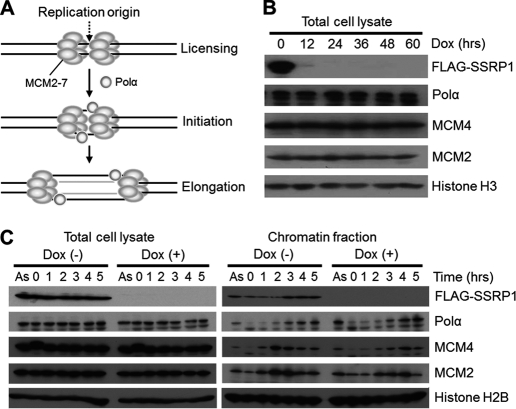
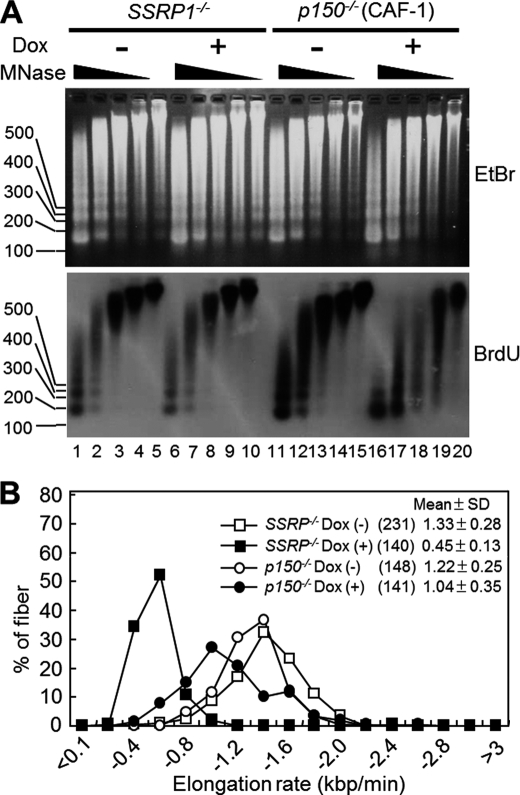
Ordered nucleosome disassembly and reassembly are required for eukaryotic DNA replication. The facilitates chromatin transcription (FACT) complex, a histone chaperone comprising Spt16 and SSRP1, is involved in DNA replication as well as transcription. FACT associates with the MCM helicase, which is involved in DNA replication initiation and elongation. Although the FACT-MCM complex is reported to regulate DNA replication initiation, its functional role in DNA replication elongation remains elusive. To elucidate the functional role of FACT in replication fork progression during DNA elongation in the cells, we generated and analyzed conditional SSRP1 gene knock-out chicken (Gallus gallus) DT40 cells. SSRP1-depleted cells ceased to grow and exhibited a delay in S-phase cell cycle progression, although SSRP1 depletion did not affect the level of chromatin-bound DNA polymerase α or nucleosome reassembly on daughter strands. The tracking length of newly synthesized DNA, but not origin firing, was reduced in SSRP1-depleted cells, suggesting that the S-phase cell cycle delay is mainly due to the inhibition of replication fork progression rather than to defects in the initiation of DNA replication in these cells. We discuss the mechanisms of how FACT promotes replication fork progression in the cells.


Figures

FIGURE 1.
FIGURE 1.
Depletion of SSRP1 causes cell death. A, preparation of SSRP1−/− + FLAG-SSRP1 (SSRP1−/−) cells. Schematic representation of the SSRP1 locus and gene-targeting constructs. Closed boxes indicate exons. puro and bsr indicate the drug resistance genes of puromycin and blasticidin S, respectively. B, suppression of SSRP1 mRNA expression in SSRP−/− cells by Dox. RNA was prepared from SSRP1−/− cells cultured in the presence of Dox for the indicated periods. SSRP1 cDNA was prepared by real-time reverse transcription PCR and electrophoresed in a 2% agarose gel. CDC7 was used as the loading control. It is worth noting that another group independently constructed a similar cell line using DT40 cells (65). C, depletion of the FLAG-SSRP1 protein. Whole cell lysates were prepared from “wild-type (WT)” or SSRP−/− + FLAG-SSRP1 (SSRP−/−) cells cultured in the presence of Dox for the indicated times. FLAG-SSRP1, Spt16, and histone H3 (loading control) were detected by Western blotting. D, growth curves. WT or SSRP−/− cells (1 × 10⁵) were inoculated in 1 ml of medium and passaged daily. Dox was added at time 0.
FIGURE 2.
FIGURE 2.
The Pob3 domain is sufficient for cell viability. A, schematic presentation of SSRP1 deletion mutants. Pob3-(1–520) and –(1–439) are referred to in the text as “Pob3 domain” and “Pob3 domain without the acidic region,” respectively. The “Nhp6 domain” lacks a Pob3 domain. Budding yeast Pob3-M (32), corresponding to the part of the Pob3 domain (1–439) without the acidic region, is described under “Discussion.” B, growth curves. SSRP−/− cells expressing each SSRP1 fragment described in A were cultured in the absence (−) or presence (+) of Dox (upper and lower panels, respectively). Because full-length FLAG-SSRP1 is regulated by Dox, but not the SSRP1 fragments, each SSRP1 fragment is expressed independently of the presence of Dox.
FIGURE 3.
FIGURE 3.
Depletion of SSRP1 delays the progression of S phase. A, cell cycle distribution of SSRP1-depleted cells. Cells were cultured in the presence of Dox for the indicated times, pulse-labeled with BrdU for 10 min, and harvested. The cells were stained with FITC anti-BrdU to detect BrdU uptake and with propidium iodide (PI) to detect DNA. Left panels show y axis, BrdU uptake; and x axis, total DNA. Right panels show y axis, cell number; and x axis, BrdU uptake. B, cell cycle progression of SSRP1-depleted cells after release from M-phase block. Cells were cultured in the presence (right) or absence (left) of Dox for 36 h and then cultured in the presence of nocodazole (500 ng/ml) for 8 h. After release from the M-phase block, cells were collected at 1-h intervals, fixed, and stained with PI, and DNA content was analyzed by flow cytometry. Asyn, asynchronous.
FIGURE 4.
FIGURE 4.
Analysis of DNA replication elongation. A, images of typical DNA fibers. SSRP−/− cells cultured in the presence (+) or absence (−) of Dox for 48 h were successively pulse-labeled with CldU (blue) and IdU (green). DNA fibers were stained as described under “Experimental Procedures.” B, DNA replication elongation rates as determined by the percentage of DNA fibers containing CldU. The lengths of DNA fibers (only CldU tracks that connected with IdU tracks) prepared as shown in A were measured, and DNA replication elongation rates (mean ± S.D.) were calculated as fiber length divided by pulse-labeling time. Results using wild-type cells are also shown. The numbers in parentheses indicate the number of samples tested. C, fork rates in SSRP1−/− cells expressing SSRP1 fragments. Cells were cultured in the presence (+) or absence (−) of Dox for 48 h and successively pulse-labeled with CldU and IdU. Only CldU tracks that connected with IdU tracks were measured. Fork rates were calculated and are displayed as mean ± S.D. The numbers in parentheses indicate the number of samples.
FIGURE 5.
FIGURE 5.
Analysis of DNA replication initiation. A, origin to origin distance. Images of DNA fibers (supplemental Fig. S3) were obtained using a molecular combing assay (“Experimental Procedures”). B, the distances between adjacent origins (in kbp) in clusters of replicons were determined and are displayed as mean ± S.D. The numbers in parentheses indicate the number of samples.
FIGURE 6.
FIGURE 6.
Chromatin binding of MCM and Polα in SSRP1-depleted cells. A, MCM and Polα are known to be involved in both DNA replication initiation and elongation. B, the total amount of MCM and Polα in asynchronous cells. Cells were cultured for the indicated periods in the presence of Dox, and whole cell lysates were prepared. The indicated proteins were detected by Western blotting. C, time course of levels of chromatin-bound MCM and DNA polymerase α (Polα). SSRP−/− cells were cultured in the presence (+) or absence (−) of Dox for 36 h, and then cultured in the presence of nocodazole (500 ng/ml) for 8 h to cause M-phase cell cycle arrest. After release from the M-phase block, cells were collected at 1-h intervals. Cell lysates and chromatin fractions were analyzed by Western blotting.
FIGURE 7.
FIGURE 7.
Nucleosome assembly and DNA replication elongation rates in SSRP1- versus p150-deficient cells. A, nucleosome reassembly on newly synthesized DNA. After incubation in the presence or absence of Dox for 48 h, SSRP−/− or p150−/− cells were pulse-labeled with BrdU for 45 min. Nuclei were prepared and treated with MNase at 0.20 (lanes 1, 6, 11, and 16), 0.067 (lanes 2, 7, 12, and 17), 0.022 (lanes 3, 8, 13, and 18), 0.007 (lanes 4, 9, 14, and 19), and 0 (lanes 5, 10, 15, and 20) units/ml. DNA was resolved in 2% agarose gels, stained with ethidium bromide (EtBr) (upper panel), transferred onto a Hybond N membrane, and detected with an anti-BrdU antibody (lower panel). B, fork rates in SSRP1−/− versus p150−/− cells. Cells were cultured in the presence (+) or absence (−) of Dox for 48 h and successively pulse-labeled with CldU and IdU. Only CldU tracks that connected with IdU tracks were measured. Fork rates were calculated and are displayed as mean ± S.D. The numbers in parentheses indicate the number of samples.

References

    1. Baker T. A., Bell S. P. (1998) Cell 92, 295–305 - PubMed
    1. McHenry C. S. (2003) Mol. Microbiol. 49, 1157–1165 - PubMed
    1. Kornberg R. D. (1974) Science 184, 868–871 - PubMed
    1. Luger K., Mäder A. W., Richmond R. K., Sargent D. F., Richmond T. J. (1997) Nature 389, 251–260 - PubMed
    1. Blow J. J., Dutta A. (2005) Nat. Rev. Mol. Cell Biol. 6, 476–486 - PMC - PubMed

Publication types

LinkOut - more resources