. 2011 Aug 26;286(34):29828-37.
doi: 10.1074/jbc.M111.221796. Epub 2011 Jul 8.

Coordinated post-transcriptional regulation of Hsp70.3 gene expression by microRNA and alternative polyadenylation

Affiliations

Coordinated post-transcriptional regulation of Hsp70.3 gene expression by microRNA and alternative polyadenylation

Michael Tranter et al. J Biol Chem. .

Abstract

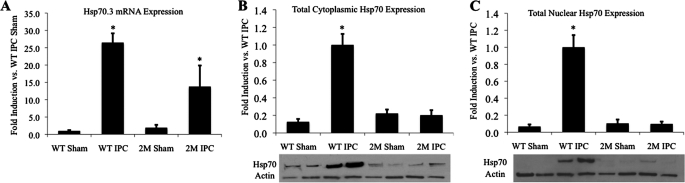
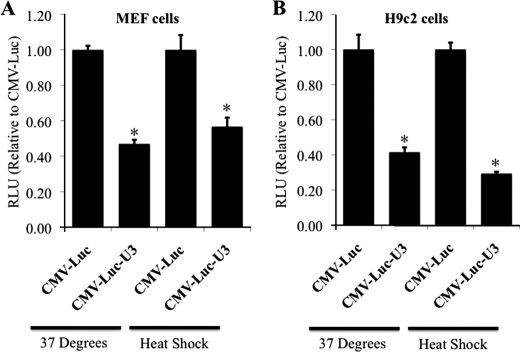
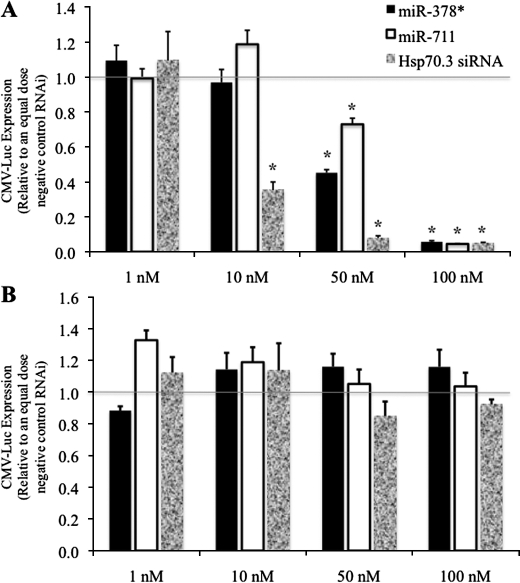
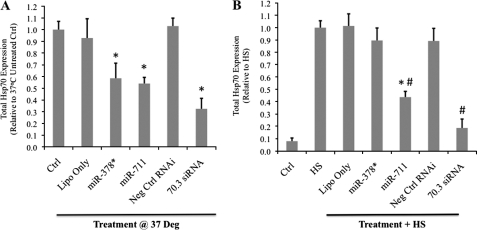
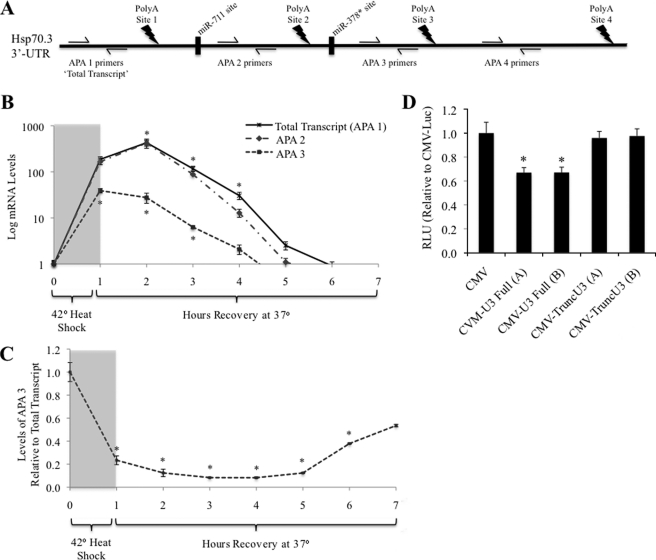
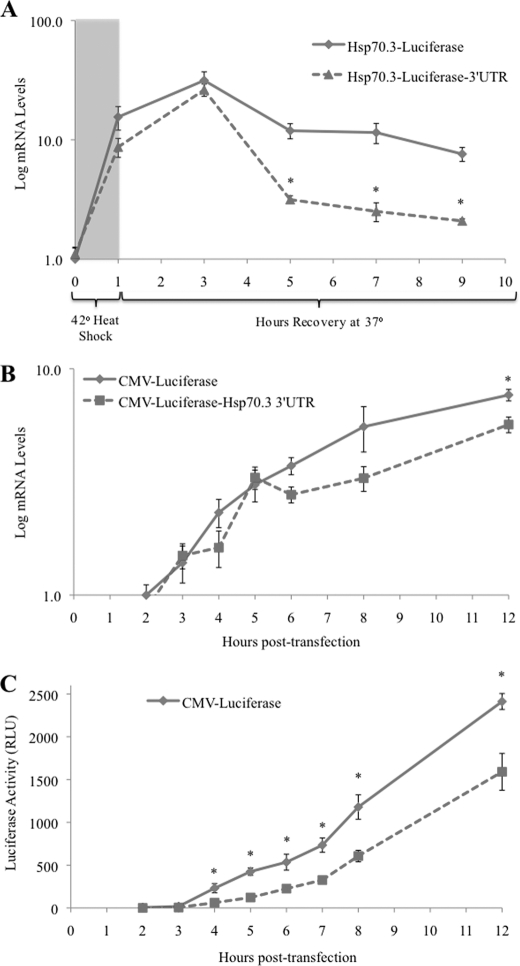
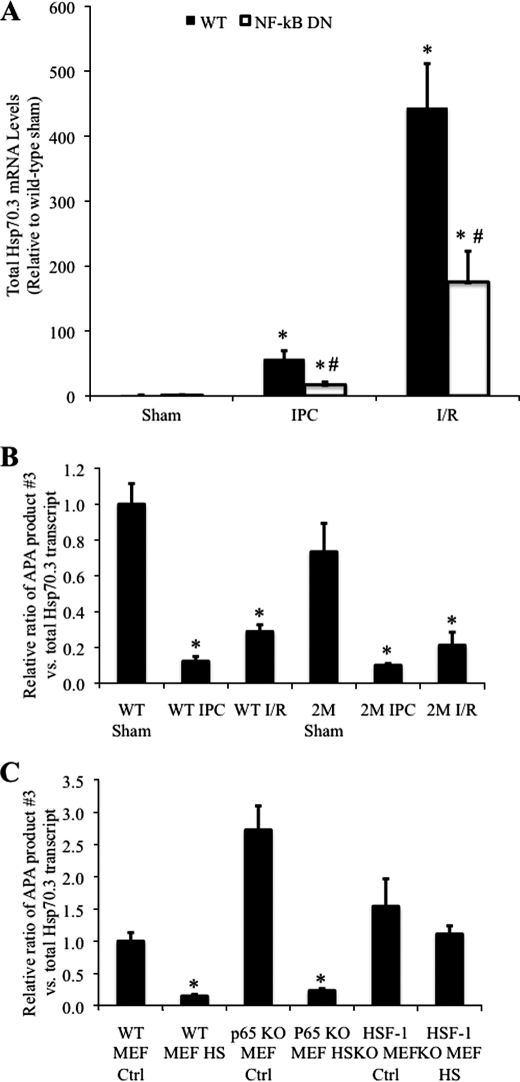
Heat shock protein 70 (Hsp70) is well documented to possess general cytoprotective properties in protecting the cell against stressful and noxious stimuli. We have recently shown that expression of the stress-inducible Hsp70.3 gene in the myocardium in response to ischemic preconditioning is NF-κB-dependent and necessary for the resulting late phase cardioprotection against a subsequent ischemia/reperfusion injury. Here we show that the Hsp70.3 gene product is subject to post-transcriptional regulation through parallel regulatory processes involving microRNAs and alternative polyadenylation of the mRNA transcript. First, we show that cardiac ischemic preconditioning of the in vivo mouse heart results in decreased levels of two Hsp70.3-targeting microRNAs: miR-378* and miR-711. Furthermore, an ischemic or heat shock stimulus induces alternative polyadenylation of the expressed Hsp70.3 transcript that results in the accumulation of transcripts with a shortened 3'-UTR. This shortening of the 3'-UTR results in the loss of the binding site for the suppressive miR-378* and thus renders the alternatively polyadenylated transcript insusceptible to miR-378*-mediated suppression. Results also suggest that the alternative polyadenylation-mediated shortening of the Hsp70.3 3'-UTR relieves translational suppression observed in the long 3'-UTR variant, allowing for a more robust increase in protein expression. These results demonstrate alternative polyadenylation of Hsp70.3 in parallel with ischemic or heat shock-induced up-regulation of mRNA levels and implicate the importance of this process in post-transcriptional control of Hsp70.3 expression.


Figures

FIGURE 1.
FIGURE 1.
Hsp70.3 expression is post-transcriptionally regulated in late IPC. A, IPC strongly induces Hsp70.3 mRNA expression that is partially, but not fully, NF-κB-dependent. B and C, Western blots show that total myocardial Hsp70 protein is increased in both the cytoplasmic and the nuclear fractions 24 h after IPC in WT mice, but not in 2M NF-κB dominant-negative mice, despite a >10-fold mRNA induction. *, p ≤ 0.05 versus WT sham.
FIGURE 2.
FIGURE 2.
The Hsp70.3 3′-UTR contains suppressive elements. The addition of the Hsp70.3 3′-UTR sequence leads to a post-transcriptional suppression of reporter expression (luciferase activity expressed as signal intensity, normalized to the same construct without the 3′-UTR) under both basal and stimulated (HS) conditions in both MEF cells (A) and H9C2 cells (B). *, p ≤ 0.05 versus CMV-Luc control. RLU, relative light units.
FIGURE 3.
FIGURE 3.
miR-378* and miR-711 suppress Hsp70.3 reporter expression via interaction with the 3′-UTR. H9c2 cardiac myoblast cells were treated with CMV-luciferase reporters with (A) or without (B) the Hsp70.3 3′-UTR sequence and increasing doses of miR-378*, miR-711, or an Hsp70.3 3′-UTR-specific siRNA. Results show a 3′-UTR-specific dose-dependent decrease in expression following treatment with miR-378*, miR-711, or an Hsp70.3 siRNA. *, p ≤ 0.05 versus equal dose negative control RNAi.
FIGURE 4.
FIGURE 4.
miRNA suppression of endogenous Hsp70.3 protein expression. Hsp70.1−/− MEFs were treated with 100 nm doses of miR-378*, miR-711, a non-targeting negative control RNAi (Neg Ctrl RNAi), or an Hsp70.3-targeting siRNA. A, at basal conditions, treatment with either miR-378* or miR-711 resulted in a significant reduction in Hsp70.3 protein expression as measured by Western blotting. Ctrl, control; Lipo only, Lipofectamine 2000 only. B, at heat shock, treatment with miR-711, but not miR-378*, suppressed Hsp70.3 protein induction. *, p ≤ 0.05 versus untreated controls. #, p ≤ 0.05 versus HS cells.
FIGURE 5.
FIGURE 5.
The Hsp70.3 3′-UTR contains multiple polyadenylation sites. Sequence analysis of the 3′-UTR of Hsp70.3 shows that at least four distinct polyadenylation sites are predicted within the first 1250 bases from the end of the protein coding sequence. The predicted binding site for miR-711 is located between the first and second polyadenylation signals, whereas the predicted miR-378* site is located between the third and fourth polyadenylation signals.
FIGURE 6.
FIGURE 6.
The Hsp70.3 mRNA transcript is expressed with multiple 3′-UTR lengths. A, four different size populations of Hsp70.3 3′-UTR (∼250, 650, 840, and 1240 bps) are predicted based on the four distinct polyadenylation (PolyA) sequence recognition sites found within the 3′-UTR. B, 3′-RACE results using primary MEF cells show the endogenous expression of at least four distinct Hsp70.3 3′-UTR size populations corresponding to the predicted alternative polyadenylated 3′-UTRs. The A, C, and G lanes of the gel represent the nucleotide base used at the proximal end of the oligo(dT) primer to increase PCR priming efficiency and specificity at the proximal end of the poly(A) tail.
FIGURE 7.
FIGURE 7.
Assessment of the relative transcript levels of the four different Hsp70.3 polyadenylation products. A, expression and alternative polyadenylation (PolyA) of Hsp70.3 mRNA was done via qRT-PCR amplification of specific regions of the Hsp70.3 transcript relative to the four polyadenylation sites (APA 1–4). B and C, as total post-HS expression of Hsp70.3 in MEFs increases (B), the ratio of APA 3:total transcript decreases, indicating that the 3′-UTR of the transcript is shortened via APA at site 2 rather than at site 3 (C). *, p ≤ 0.05 versus baseline control. D, CMV-luciferase reporters harboring a truncated version of the Hsp70.3 3′-UTR at APA site 2 (to mimic the APA-induced shortening of the 3′-UTR) show that post-transcriptional suppression is lost upon truncation of the 3′-UTR. *, p ≤ 0.05 versus CMV-Luc expression. RLU, relative light units.
FIGURE 8.
FIGURE 8.
Correlation of mRNA and protein production from Hsp70.3 3′-UTR luciferase reporters. A, using qRT-PCR with primers specific to an internal region of luciferase, mRNA levels of a luciferase reporter controlled by the Hsp70.3 promoter with and without the full-length Hsp70.3 3′-UTR were tracked in H9c2 cells following a 1-h HS. B, mRNA levels of CMV-luciferase reporters with and without the full-length Hsp70.3 3′-UTR were assessed in H9c2 cells beginning at 2 h after transfection. C, assessment of protein levels (as measured by luciferase activity) of CMV-luciferase reporters with and without the full-length Hsp70.3 3′-UTR were assessed in H9c2 cells beginning at 2 h after transfection. *, p ≤ 0.05 between reporter plasmids with and without the Hsp70.3 3′-UTR. RLU, relative light units.
FIGURE 9.
FIGURE 9.
APA-mediated shortening of the Hsp70.3 3′-UTR is dependent on HSF-1, but not NF-κB, activity. A, qRT-PCR was used to measure the increase in total Hsp70.3 mRNA following IPC and I/R in wild-type and NF-κB-dominant-negative (NF-κB-DN) mice. B, IPC- and I/R-induced shortening of the Hsp70.3 3′-UTR (APA 3:total transcript ratio) is maintained in NF-κB dominant-negative mice, indicating that this effect is independent of NF-κB activation in the heart. C, similar to WT MEFs, p65−/− MEFs display an HS-dependent shortening of the 3′-UTR. APA of the Hsp70.3 3′-UTR is abrogated in HSF-1−/− MEFs. In B and C, ratios of APA 3:total transcript are expressed relative to WT sham (in vivo controls) or WT MEF 37 °C control (WT MEF Ctrl) (in vitro controls). *, p ≤ 0.05 versus corresponding control group. #, p ≤ 0.05 versus wild-type.

Comment in

  • Hsf1 knock-out.
    Christians E. Christians E. J Biol Chem. 2011 Dec 2;286(48):le26. doi: 10.1074/jbc.L111.221796. J Biol Chem. 2011. PMID: 22121189 Free PMC article. No abstract available.

References

    1. Currie R. W., Karmazyn M., Kloc M., Mailer K. (1988) Circ. Res. 63, 543–549 - PubMed
    1. Mestril R., Dillmann W. H. (1995) J. Mol. Cell. Cardiol. 27, 45–52 - PubMed
    1. Donnelly T. J., Sievers R. E., Vissern F. L., Welch W. J., Wolfe C. L. (1992) Circulation 85, 769–778 - PubMed
    1. Marber M. S., Latchman D. S., Walker J. M., Yellon D. M. (1993) Circulation 88, 1264–1272 - PubMed
    1. Marber M. S., Mestril R., Chi S. H., Sayen M. R., Yellon D. M., Dillmann W. H. (1995) J. Clin. Invest. 95, 1446–1456 - PMC - PubMed

Publication types

MeSH terms

LinkOut - more resources