. 2011 Sep 16;286(37):32705-12.
doi: 10.1074/jbc.M111.227181. Epub 2011 Jul 8.

Functional in vitro analysis of the ERO1 protein and protein-disulfide isomerase pathway

Affiliations

Functional in vitro analysis of the ERO1 protein and protein-disulfide isomerase pathway

Kazutaka Araki et al. J Biol Chem. .

Abstract

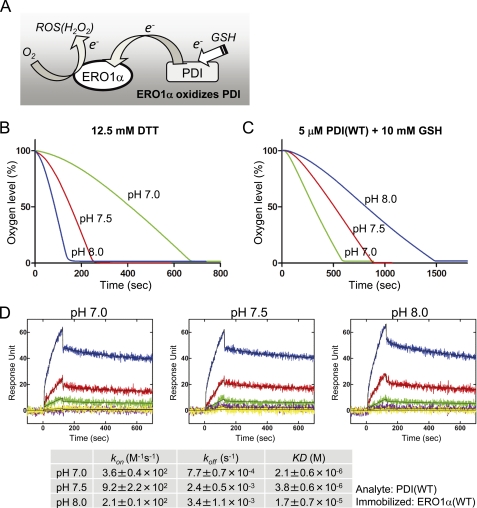
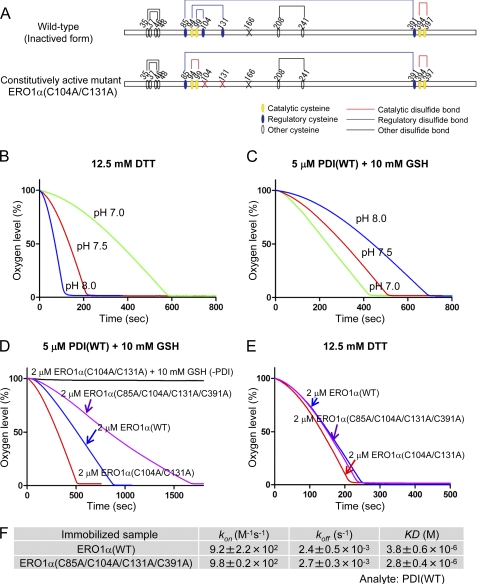
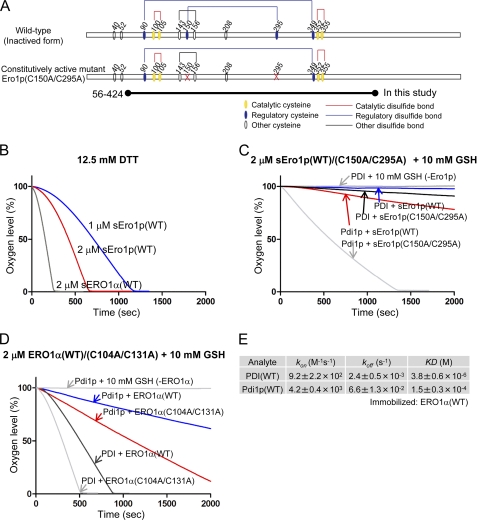
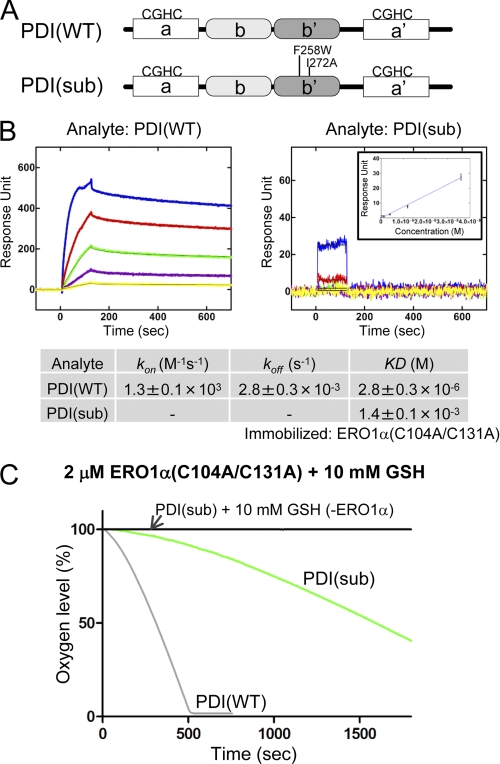
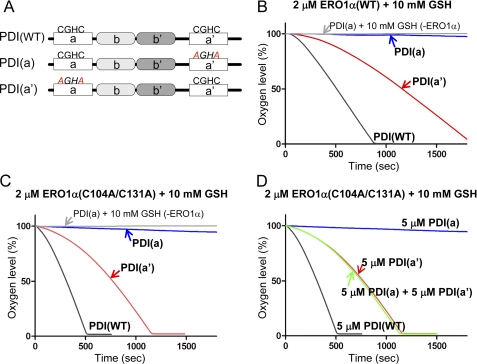
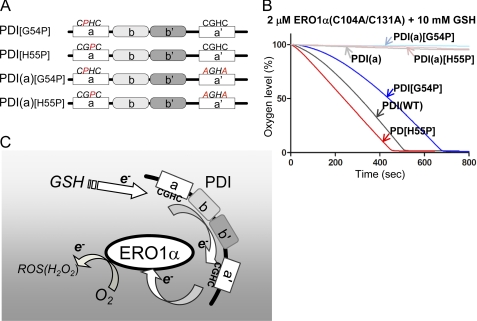
Oxidative protein folding in the endoplasmic reticulum is supported by efficient electron relays driven by enzymatic reactions centering on the ERO1-protein-disulfide isomerase (PDI) pathway. A controlled in vitro oxygen consumption assay was carried out to analyze the ERO1-PDI reaction. The results showed the pH-dependent oxidation of PDI by ERO1α. Among several possible disulfide bonds regulating ERO1α activity, Cys(94)-Cys(131) and Cys(99)-Cys(104) disulfide bonds are dominant regulators by excluding the involvement of the Cys(85)-Cys(391) disulfide in the regulation. The fine-tuned species specificity of the ERO1-PDI pathway was demonstrated by functional in vitro complementation assays using yeast and mammalian oxidoreductases. Finally, the results provide experimental evidence for the intramolecular electron transfer from the a domain to the a' domain within PDI during its oxidation by ERO1α.


Figures

FIGURE 1.
FIGURE 1.
pH-dependent oxygen consumption of ERO1α(WT). A, a schematic model of Ero1α-driven electron transfer. During the oxidation of PDI by ERO1α, ERO1α transfers electrons from PDI to O2, which in turn becomes a reactive oxygen species (ROS(H2O2)). GSH supplies electrons to PDI. Oxygen consumption by 2 μm wild-type ERO1α oxidation of 12.5 mm DTT (B), or 5 μm human PDI in the presence of 10 mm GSH (C) under different pH conditions (pH 7.0, 7.5, and 8.0). D, affinity of human PDI and wild-type ERO1α as measured by SPR spectroscopy under different pH conditions. ERO1α was immobilized on a biosensor chip, and PDI was injected as an analyte. Blue, red, green, purple, and yellow curves correspond to 36, 12, 4, 1.33, and 0.44 μm analyte, respectively. The lower column shows the calculated kinetic parameters.
FIGURE 2.
FIGURE 2.
Evaluation of regulatory disulfide bonds of ERO1α. A, wild-type and constitutively active (deregulated or hyperactive) mutant of human ERO1α. Cysteine residues are shown with circles, and the cysteine to alanine mutation sites in ERO1 are represented by an X. Structural, regulatory, and catalytic disulfides are represented by black, blue, and red lines, respectively (11). Free cysteine Cys166 of ERO1 was mutated to alanine to purify homogeneous recombinant proteins (11). Oxygen consumption by the constitutively active ERO1α oxidation of 12.5 mm DTT (B), or 5 μm human PDI in the presence of 10 mm GSH (C), under different pH conditions (pH 7.0, 7.5, and 8.0). D, kinetics of oxygen consumption by ERO1 (2 μm) wild-type or mutants, as depicted in the figure, during a reaction with 5 μm PDI in the presence of GSH (10 mm). E, oxygen consumption by 2 μm ERO1α wild type or mutants in the presence of 12.5 mm DTT. F, calculated kinetic parameters for affinity measurements between human PDI and ERO1α(WT) or ERO1α(C85A/C104A/C131A/C391A) by SPR spectroscopy.
FIGURE 3.
FIGURE 3.
In vitro complementation assay between the human PDI-ERO1α and yeast Pdi1p-Ero1p pathway. A, wild-type and constitutively active mutant of yeast Ero1p. Cysteine residues are shown with circles. Structural, regulatory, and catalytic disulfides are represented by black, blue, and red lines, respectively (7). The short form of yeast Ero1p, spanning amino acid residues 56–424, was examined; it is named sEro1p (12, 21). B, oxygen consumption by yeast sEro1p or human ERO1α oxidation of 12.5 mm DTT. Kinetics of oxygen consumption by 2 μm yeast wild-type or constitutively active sEro1p (C), or 2 μm human wild-type or constitutively active ERO1α (D), during the reaction with 5 μm yeast Pdi1p or human PDI in the presence of GSH (10 mm). E, calculated kinetic parameters for affinity measurements between human PDI and ERO1α(WT) or yeast Pdi1p and ERO1α(WT) by SPR spectroscopy. Sensorgrams are shown in supplemental Fig. S2.
FIGURE 4.
FIGURE 4.
Effect of point mutations of the PDI b′ domain on the binding affinity for ERO1α and the rate of oxygen consumption. A, schematic representation of human PDI protein and the point mutations introduced into the b′ domain of PDI, PDI(sub). B, affinity measurements between wild-type PDI and constitutively active ERO1α, or PDI(sub) and constitutively active ERO1α by SPR spectroscopy. Blue, red, green, purple, and yellow curves correspond to 36, 12, 4, 1.33, and 0.44 μm analyte, respectively. The inset in the right panel shows equilibrium analysis based on a set of response units of the steady state (y-axis) at each analyte concentration (x-axis). The lower column shows the calculated kinetic parameters. C, kinetics of oxygen consumption by 2 μm constitutively active ERO1α during the reaction with 5 μm PDI(WT) or PDI(sub) in the presence of GSH (10 mm).
FIGURE 5.
FIGURE 5.
Selective oxidation of ERO1α toward the a′ domain and the intramolecular electron relay within PDI. A, schematic representation of human PDI proteins with the -CGHC- active sites and the mutated -AGHA sites indicated. Kinetics of oxygen consumption by 2 μm wild-type ERO1α (B), or constitutively active ERO1α (C), during the reaction with 5 μm human PDI variants, as depicted in the figure, in the presence of GSH (10 mm). D, oxygen consumption by the 2 μm constitutively active ERO1α during the oxidation of 5 μm human PDI variants, including PDI(WT), PDI(a), and PDI(a′), or the mixture of PDI(a) and PDI(a′).
FIGURE 6.
FIGURE 6.
Modulation of the reduction potential of the a domain affects the net oxidation rate of PDI by ERO1α. A, schematic representation of human PDI proteins with the mutated -CPHC-, -CGPC-, and -AGHA- sites indicated. B, the kinetics of oxygen consumption by 2 μm constitutively active ERO1α in a reaction containing 5 μm of each human PDI variant, as indicated in the figure, in the presence of GSH (10 mm). C, schematic model illustrating the interaction of and electron transfer relays between ERO1α and PDI. GSH supplies the electron, probably to the a domain of PDI. Following internal electron transfer from the a to the a′ domain, ERO1α receives the electron from the a′ domain. Intermolecular electron transfer would be stochastically constrained.

References

    1. Ellgaard L., Helenius A. (2003) Nat. Rev. Mol. Cell Biol. 4, 181–191 - PubMed
    1. Hoseki J., Ushioda R., Nagata K. (2010) J. Biochem. 147, 19–25 - PubMed
    1. Anelli T., Sitia R. (2008) EMBO J. 27, 315–327 - PMC - PubMed
    1. Appenzeller-Herzog C., Ellgaard L. (2008) Biochim. Biophys. Acta 1783, 535–548 - PubMed
    1. Hatahet F., Ruddock L. W., Ahn K., Benham A., Craik D., Ellgaard L., Ferrari D., Ventura S. (2009) Antioxid. Redox. Signal 11, 2807–2850 - PubMed

Publication types

MeSH terms