. 2011 Sep 2;286(35):30352-30360.
doi: 10.1074/jbc.M111.269464. Epub 2011 Jul 13.

Cholangiocyte N-Ras protein mediates lipopolysaccharide-induced interleukin 6 secretion and proliferation

Affiliations

Cholangiocyte N-Ras protein mediates lipopolysaccharide-induced interleukin 6 secretion and proliferation

Steven P O'Hara et al. J Biol Chem. .

Abstract

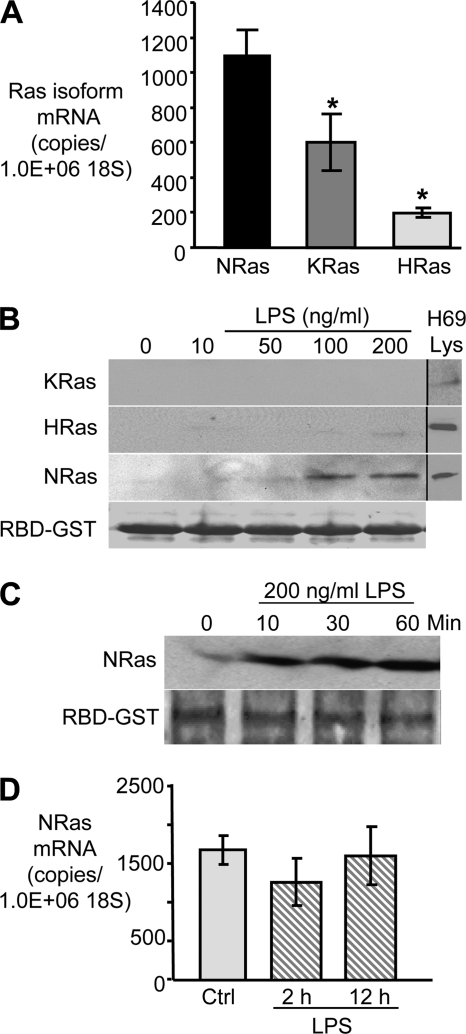
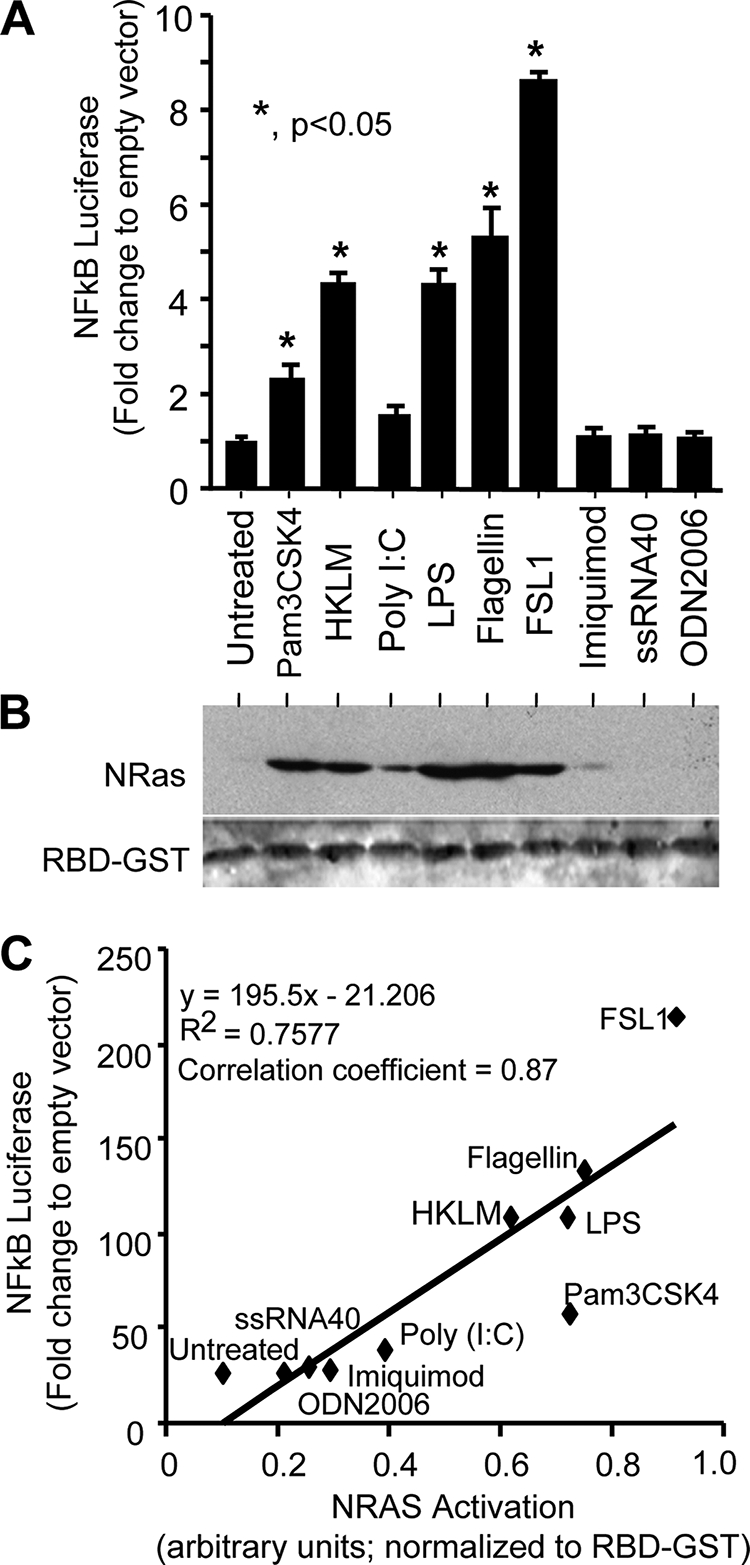
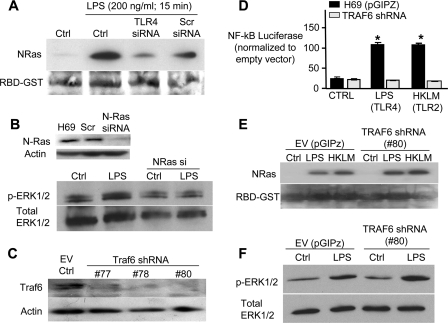
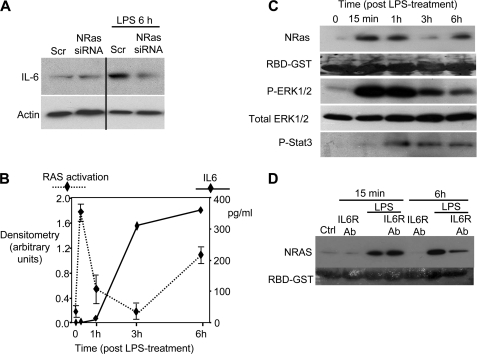
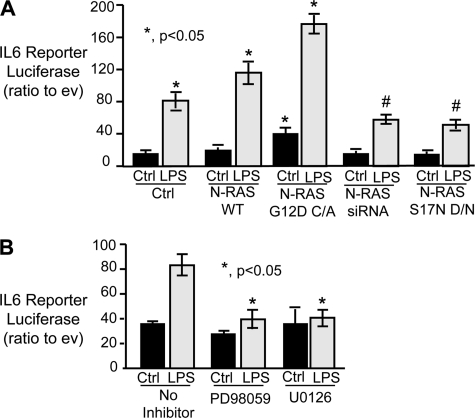
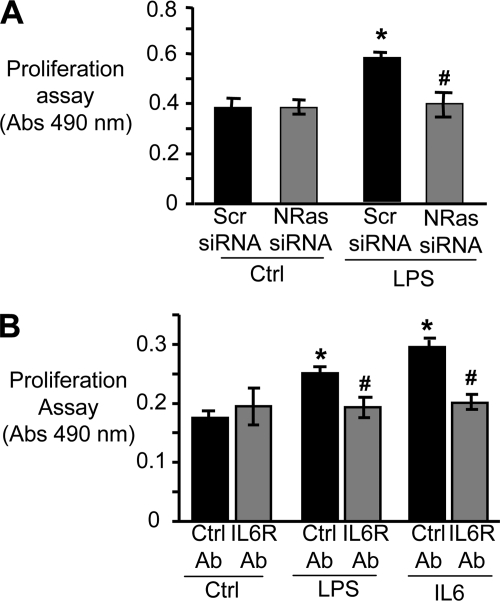
Cholangiocytes, the epithelial cells lining the bile ducts in the liver, are periodically exposed to potentially injurious microbes and/or microbial products. As a result, cholangiocytes actively participate in microbe-associated, hepatic proinflammatory responses. We previously showed that infection of cultured human cholangiocytes with the protozoan parasite, Cryptosporidium parvum, or treatment with gram-negative bacteria-derived LPS, activates NFκB in a myeloid differentiation 88 (MyD88)-dependent manner. Here, we describe a novel signaling pathway initiated by Toll-like receptors (TLRs) involving the small GTPase, Ras, that mediates cholangiocyte proinflammatory cytokine production and induction of cholangiocyte proliferation. Using cultured human cholangiocytes and a Ras activation assay, we found that agonists of plasma membrane TLRs (TLR 1, 2, 4, 5, and 6) rapidly (<10 min) activated N-Ras, but not other p21 Ras isoforms, resulting in the rapid (<15 min) phosphorylation of the downstream Ras effector, ERK1/2. RNA interference-induced depletion of TRAF6, a downstream effector of MyD88 and known activator of MAPK signaling, had no effect on N-Ras activation. Following N-Ras activation the proinflammatory cytokine, IL6, is rapidly secreted. Using a luciferase reporter, we demonstrated that LPS treatment induced IL6 promoter-driven luciferase which was suppressed using MEK/ERK pharmacologic inhibitors (PD98059 or U0126) and RNAi-induced depletion of N-Ras. Finally, we showed that LPS increased cholangiocyte proliferation (1.5-fold), which was inhibited by depletion of N-Ras; TLR agonist-induced proliferation was also inhibited following pretreatment with an IL6 receptor-blocking antibody. Together, our results support a novel signaling axis involving microbial activation of N-Ras likely involved in the cholangiocyte pathogen-induced proinflammatory response.


Figures

FIGURE 1.
FIGURE 1.
N-Ras is the predominant p21 Ras isoform expressed in cultured cholangiocytes. A, RNA was extracted from confluent H69 cells, and quantitative RT-PCR was performed using p21 Ras isoform-specific PCR primers. N-Ras mRNA is expressed at a level 2-fold and 5-fold greater than K-Ras and H-Ras, respectively (p < 0.05). Data were normalized to the 18 S rRNA level and expressed as copies of RAS mRNA/106 copies of 18 S rRNA. B, LPS activates N-Ras in a dose-dependent manner. Confluent H69 cells were incubated in the presence of LPS (0, 10, 50, 100, or 200 ng/ml) for 15 min. Activated RAS was pulled down using RAF-RBD-agarose beads, and immunoblotting for N-Ras, K-Ras, and H-Ras was performed. Activated N-Ras was detected at doses as low as 50 ng/ml, whereas activated K-Ras and H-Ras were not detected after LPS treatment. Total RBD-GST was used as a loading control. C, LPS-induced N-Ras activation is rapid and persistent. Activated N-Ras was detected within 10 min following LPS treatment and remained activated through 60 min after LPS treatment. Total RBD-GST was used as a loading control. D, expression of N-Ras in cholangiocytes following treatment with LPS was quantitated by RT-PCR and normalized to 106 copies of 18 S rRNA. No significant increase was observed in N-Ras mRNA expression following LPS treatment. Quantitative PCR data are presented as mean ± S.E. (error bars) from three independent experiments; *, p < 0.05 compared with N-Ras.
FIGURE 2.
FIGURE 2.
TLR agonists induce NFκB reporter luciferase and N-Ras activation. A, tandem NFκB consensus sites were cloned into the luciferase expression plasmid, pGL4.22. This plasmid was co-transfected into cholangiocytes with the transfection control plasmid TK-Renilla. Treatment with membrane-bound TLR agonists Pam3CSK4 (TLR1/2), HKLM (TLR2), LPS (TLR4), flagellin (TLR5), and FSL-1 (TLR2/6) induced NFκB-driven luciferase expression. Expression is presented as -fold change NFκB-driven firefly luciferase: Renilla luciferase compared with empty pGL4.22 vector firefly luciferase: Renilla luciferase. Data are represented as mean ± S.E. (error bars). B, an N-Ras activation assay was performed on TLR agonist-treated cultured cholangiocytes. Again, the membrane-bound TLR agonists Pam3CSK4, HKLM, LPS, flagellin, and FSL-1 exhibited robust N-Ras activation, whereas agonists for the cytoplasmic TLRs exhibited minimal N-Ras activation. Total RBD-GST was used as a normalizing control. C, a correlation coefficient was performed to assess the linear relationship between TLR agonist-induced NFκB-driven luciferase activity and N-Ras activation. A strong correlation is demonstrated with a correlation coefficient = 0.87 (y = 195.5x − 21.206; R2 = 0.7577).
FIGURE 3.
FIGURE 3.
N-Ras activation is dependent on TLR4 but not TRAF6. A, H69 cells were transfected with TLR4-siRNA (50 nm), scrambled (Scr)-siRNA (50 nm), or FuGENE HD alone (control, Ctrl) 24 h prior to treatment. The cells were treated with LPS (200 ng/ml) for 15 min, and the RAS activation assay was performed. Ponceau Red stain was utilized to detect RBD-GST to confirm equal loading. N-Ras activation was observed following LPS treatment; however, the TLR4-siRNA diminished N-Ras activation compared with both LPS-treated control and LPS-treated cell transfected with the scrambled control (Scr siRNA). B, following a 15-min LPS treatment, an increase in phosphorylated ERK is detected in H69 cells. However, transfection of H69 cell with an N-Ras siRNA, which effectively depleted N-Ras, blocked LPS-induced ERK phosphorylation. C, stable transfections of H69 cells, using three different TRAF-6 shRNA constructs (#77, 78, and 80) or with the pGIPZ empty vector were performed. Following stable clone selection, immunoblotting was performed for TRAF6. The 60-kDa TRAF6 protein was detected in the pGIPZ-transfected cells, but TRAF6 was largely diminished in the shRNA expressing cell lines. D, the NFκB luciferase reporter system was utilized to confirm the functional depletion of TRAF6 in the cells expressing shRNA #80. Cholangiocytes stably transfected with either the pGIPZ empty vector (black bars) or TRAF6-shRNA (gray bars) were treated with LPS (200 ng/ml) or HKLM (1 × 10⁸ cells/ml) for 5 h followed by the Dual Luciferase Reporter assay. Both LPS and HKLM induced NFκB-driven luciferase in pGIPZ-transfected cells (*, p < 0.05 compared with control untreated cells), whereas the TRAF6-shRNA-expressing cells showed no increase in NFκB-driven luciferase activity. Data are presented as mean ± S.E. (error bars). E, an N-Ras activation assay was also performed on LPS-treated TRAF6-depleted cells. The pGIPz control transfected or TRAF6-depleted cells were treated with LPS or HKLM for 15 min. N-Ras activation was not diminished in those cells depleted of TRAF6. The membrane was stained with Ponceau Red to confirm equal loading. EV, empty vector. F, depletion of TRAF6 had no effect on LPS-induced ERK phosphorylation. LPS (200 ng/ml for 15 min) treatment of both the pGIPZ empty vector control cells and TRAF6-depleted cells resulted in a similar increase in phosphorylation of ERK1/2 as demonstrated by Western blotting.
FIGURE 4.
FIGURE 4.
LPS induces IL6 expression in an N-Ras-dependent manner. A, H69 cells transfected with either the scrambled (Scr) or N-Ras siRNA were cultured in the presence or absence of LPS (200 ng/ml) for 6 h, and IL6 immunoblotting was performed. IL6 expression was induced in the cells transfected with the scrambled siRNA; however, cells depleted of N-Ras exhibited no increase in IL6 expression at this time point. Actin was blotted as a loading control. B, cholangiocytes were treated with LPS (200 ng/ml) for 15 min, washed, and cultured over the course of 6 h. An IL6 ELISA was performed on tissue culture supernatant, and an N-Ras activation assay was performed on the cellular lysate (n = 3). N-Ras activation exhibited a biphasic response to LPS-treatment. Activation of N-Ras occurred immediately following LPS exposure (15 min), decreased at 1 h, and increased again after 3 h. In contrast, an increase in IL6 secretion was first detected 1 h after LPS treatment and was consistently elevated from 3 h after LPS treatment. C, the cellular lysate from each time point was utilized for an N-Ras activation assay and immunoblotting for phosphorylated ERK1/2, total ERK1/2 (loading control), and phosphorylated STAT3. N-Ras activation was observed at the 15-min time point and correlated with the phosphorylation of ERK1/2. In contrast, STAT3 phosphorylation was delayed (1 h) and remained elevated through 6-h after LPS treatment. D, an IL6 receptor inhibitory antibody (IL6R Ab) diminishes N-Ras activation at the 6-h time point. Cells were cultured in the presence or absence of an IL6 inhibitory antibody and in the presence or absence of LPS. The IL6-inhibiting antibody did not inhibit N-Ras activation 15 min after LPS treatment, but diminished N-Ras activation at the 6-h time point.
FIGURE 5.
FIGURE 5.
LPS induces IL6 promoter-driven luciferase reporter in an N-Ras- and ERK-dependent manner. A, the H69 cells were transfected with N-Ras WT, N-Ras G12D constitutively active (C/A), N-Ras siRNA, or N-Ras S17N dominant negative plasmid and treated with LPS (200 ng/ml), and a Dual Luciferase assay was performed. In the absence of LPS, the N-Ras G12D constitutively active mutant was the only constructed exhibiting a significant increase in IL6 reporter luciferase (*, p < 0.05). Following LPS stimuli, both N-Ras WT and the constitutive active mutant (G12D C/A) showed significant increases in IL6 reporter luciferase compared with LPS-treated control cells. In contrast, the N-Ras siRNA and dominant negative mutant (S17N D/N) significantly decreased IL6 reporter luciferase compared with control LPS-treated cells. B, the IL6 promoter-driven luciferase reporter assay was performed in the presence and absence of the MEK/ERK inhibitors PD98059 and U0126. Both inhibitors significantly diminished LPS-dependent IL6 promoter-driven luciferase activity compared with cholangiocytes cultured in the absence of inhibitors (*, p < 0.05). Expression is presented as -fold change in IL6 promoter-driven firefly luciferase: Renilla luciferase compared with empty pGL4.22 vector firefly luciferase: Renilla luciferase. Data are represented as mean ± S.E. (error bars; n = 5).
FIGURE 6.
FIGURE 6.
N-Ras modulates LPS-induced cholangiocyte proliferation through IL6. A, cholangiocytes were transfected with N-Ras siRNA (50 nm) for 24 h. Proliferation was assessed using the CellTiter 96 Aqueous One Solution Cell Proliferation Assay. Cells treated with LPS (200 ng/ml) exhibited a significant (*, p < 0.05) increase in proliferation 24 h after LPS treatment compared with uninfected cells. However N-Ras depletion using the N-Ras siRNA significantly reduced LPS-induced cholangiocyte proliferation (#, p < 0.05) compared with the LPS-treated cells in the absence of N-Ras siRNA. B, to functionally validate the importance of IL6 autocrine signaling in LPS-induced proliferation the cells were treated with LPS or IL6 in the absence or presence of the IL6R-blocking antibody or a control, nonspecific isotype-matched control antibody. The proliferation assay was performed 24 h after treatment. In the absence of the IL6R-blocking antibody, LPS and IL6 significantly increased cholangiocyte proliferation (*, p < 0.05) compared with control cholangiocytes. In contrast, when the cells were pretreated with IL6-blocking antibody the proliferation rates following LPS or IL6 treatment were significantly reduced (*, p < 0.05) compared with treated cells cultured in the presence of the control Ab.

Similar articles

Cited by

References

    1. Jafri M., Donnelly B., Bondoc A., Allen S., Tiao G. (2009) J. Pediatr. Surg. 44, 500–507 - PMC - PubMed
    1. Harada K., Shimoda S., Sato Y., Isse K., Ikeda H., Nakanuma Y. (2009) Clin. Exp. Immunol. 157, 261–270 - PMC - PubMed
    1. Karrar A., Broomé U., Södergren T., Jaksch M., Bergquist A., Björnstedt M., Sumitran-Holgersson S. (2007) Gastroenterology 132, 1504–1514 - PubMed
    1. Chen X. M., O'Hara S. P., LaRusso N. F. (2008) Immunol. Cell Biol. 86, 497–505 - PMC - PubMed
    1. Harada K., Ozaki S., Kono N., Tsuneyama K., Katayanagi K., Hiramatsu K., Nakanuma Y. (2001) J. Pathol. 193, 218–223 - PubMed

Publication types