. 2011 Aug;22(8):1429-34.
doi: 10.1681/ASN.2010111143. Epub 2011 Jul 14.

Noninvasive evaluation of kidney hypoxia and fibrosis using magnetic resonance imaging

Affiliations

Noninvasive evaluation of kidney hypoxia and fibrosis using magnetic resonance imaging

Tsutomu Inoue et al. J Am Soc Nephrol. 2011 Aug.

Abstract

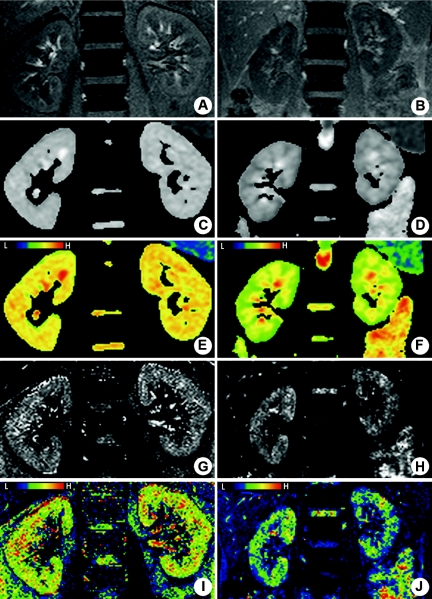
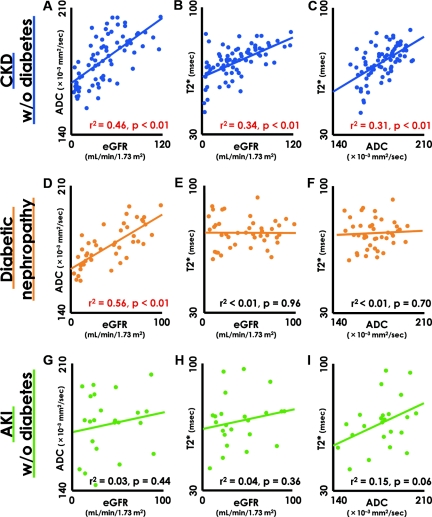
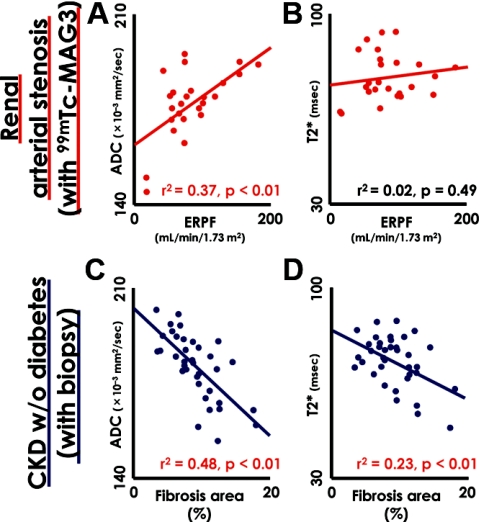
Interstitial fibrosis and hypoxia accelerate the progression of CKD, but clinical tools to quantitate these factors in patients are lacking. Here, we evaluated the use of two magnetic resonance imaging (MRI) techniques, diffusion-weighted (DW)-MRI and blood oxygen level-dependent (BOLD)-MRI, to assess kidney fibrosis and hypoxia of the cortex in 142 patients with either diabetic nephropathy (n = 43), CKD without diabetes (n = 76), or acute kidney injury (AKI) (n = 23). Apparent diffusion coefficient (ADC) values of DW-MRI correlated with estimated glomerular filtration rates (eGFR) in the diabetic nephropathy and CKD groups (r(2) = 0.56 and r(2) = 0.46, respectively). Although the T2* values of BOLD-MRI and eGFR displayed good correlation in the CKD group (r(2) = 0.38), we did not observe a significant correlation between these values in the diabetic nephropathy group, suggesting that factors other than tubulointerstitial alteration determine the degree of hypoxia in the renal cortex. In the AKI group, neither the T2* nor ADC values correlated with eGFR. Renal biopsies from patients with CKD demonstrated that the T2* and ADC MRI values correlated with renal pathology. Taken together, ADC and T2* values appear to serve as accurate indices for evaluating renal tubulointerstitial alterations and parenchymal hypoxia, respectively, in the cortex. Functional MRI can thus contribute to multilateral, noninvasive, in vivo assessment of kidney function.


Figures

Figure 1.
Figure 1.
BOLD- and DW-MRI of kidneys. Representative magnetic resonance images of a 37-year-old healthy male volunteer (A, C, E, G, and I) and a 40-year-old female chronic kidney disease patient with chronic glomerulonephritis (B, D, F, H, and J) without diabetes. (A and B) Coronal proton density-weighted half-Fourier single-shot fast spin echo images. (C through F) Apparent diffusion coefficient (ADC) maps. (G through J) T2* maps. In E, F, I, and J, pseudo-color has been applied to accurately discriminate the difference between the ADC/T2* values of C, D, G, and H, respectively. For example, blue represents the areas of lowest T2* values and oxyhemoglobin levels, whereas green, yellow, and red, in that order, represent increasing T2* values and higher oxyhemoglobin levels on the colored T2* map.
Figure 2.
Figure 2.
Relationship among ADC values, T2* values, and residual kidney function. (A through C) Decreased eGFR is accompanied by reduced apparent diffusion coefficient (ADC) and T2* values in CKD patients without diabetes. (D and E) In the case of diabetic nephropathy patients, the ADC value and eGFR showed a significant positive correlation (D), but no correlation was noted between the T2* value and eGFR (E). (F) ADC was not a determinant of the T2* value. (G–I) In the AKI patients, ADC and T2* values were independent of eGFR. In the correlation graphs, closed circles indicate individual subjects, whereas continuous lines in the graph indicate a regression line. The red-colored data indicate statistical significance of correlation. CKD, chronic kidney disease; AKI, acute kidney injury; eGFR, estimated GFR.
Figure 3.
Figure 3.
Correlation between kidney biopsies and 99mTc-MAG3 scintigraphy and functional magnetic resonance imaging (MRI) results. (A) The ADC values and the ERPF determined by diffusion-weighted (DW)-MRI and 99mTc-MAG3 scintigraphy, respectively, showed a significant positive correlation. (B) However, no correlation was observed between the BOLD-MR T2* values and ERPF. (C and D) The percentage of fibrotic area relative to the cross-sectional area (fibrosis area [%]) in each renal biopsy of 37 CKD patients, as determined by Masson's trichrome staining, is plotted against ADC (C) and T2* (D) values determined by functional MRI. Increased fibrosis was significantly correlated with reduced ADC and T2* values in CKD patients without diabetes. The continuous lines in the graph indicate a regression line. The red-colored data indicate statistical significance of correlation. CKD, chronic kidney disease; 99mTc-MAG3, 99mTc-mercaptoacetyltriglycine; ERPF, effective renal plasma flow.

References

    1. Nangaku M: Chronic hypoxia and tubulointerstitial injury: A final common pathway to end-stage renal failure. J Am Soc Nephrol 17: 17–25, 2006 - PubMed
    1. Le Bihan D, Breton E, Lallemand D, Aubin M, Vignaud J, Laval-Jeantet M: Separation of diffusion and perfusion in intravoxel incoherent motion MR imaging. Radiology 168: 497–505, 1988 - PubMed
    1. Boulanger Y, Amara M, Lepanto L, Beaudoin G, Nguyen B, Allaire G, Poliquin M, Nicolet V: Diffusion-weighted MR imaging of the liver of hepatitis C patients. NMR Biomed 16: 132–136, 2003 - PubMed
    1. Thoeny HC, De Keyzer F, Oyen RH, Peeters RR: Diffusion-weighted MR imaging of kidneys in healthy volunteers and patients with parenchymal diseases: Initial experience. Radiology 235: 911–917, 2005 - PubMed
    1. Togao O, Doi S, Kuro-o M, Masaki T, Yorioka N, Takahashi M: Assessment of renal fibrosis with diffusion-weighted MR imaging: Study with murine model of unilateral ureteral obstruction. Radiology 255: 772–780, 2010 - PMC - PubMed