. 2011 Aug 18;476(7360):346-50.
doi: 10.1038/nature10350.

Functional genomics reveal that the serine synthesis pathway is essential in breast cancer

Affiliations

Functional genomics reveal that the serine synthesis pathway is essential in breast cancer

Richard Possemato et al. Nature. .

Abstract

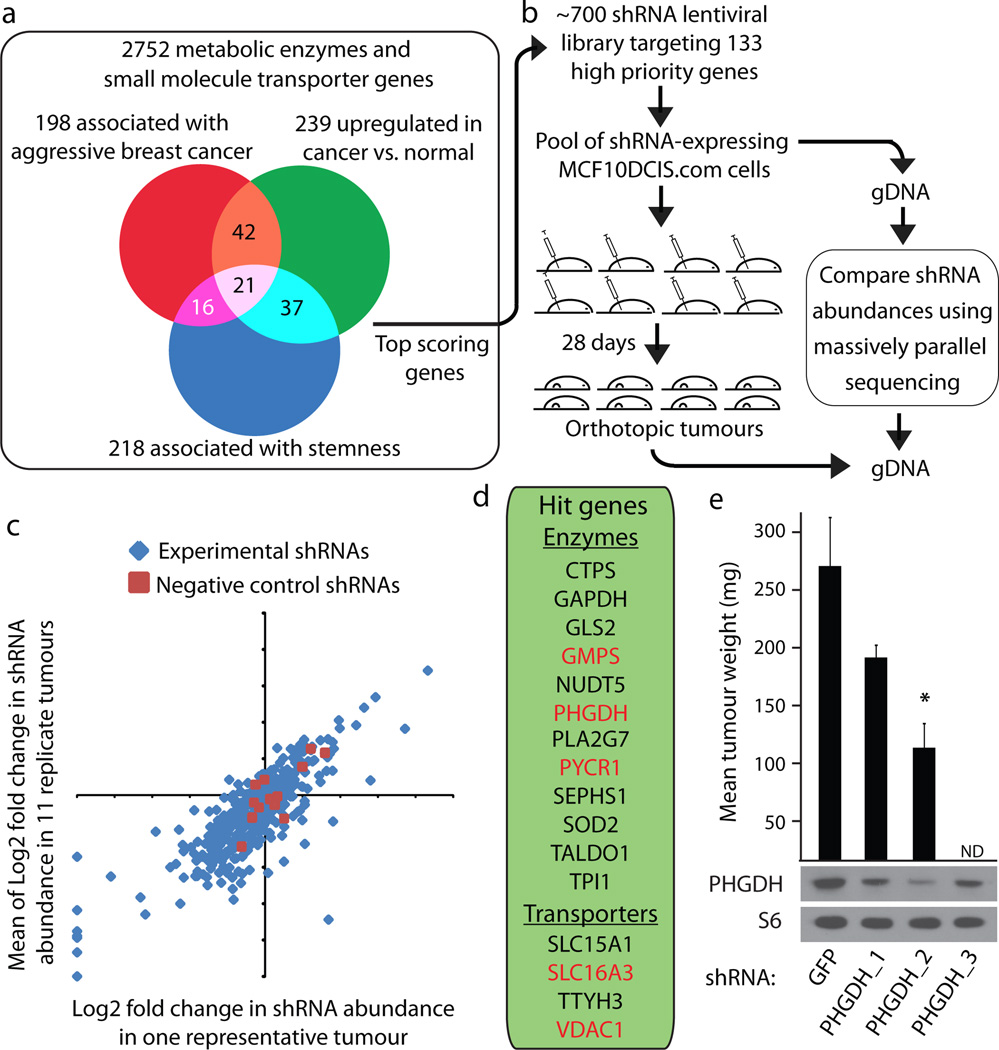
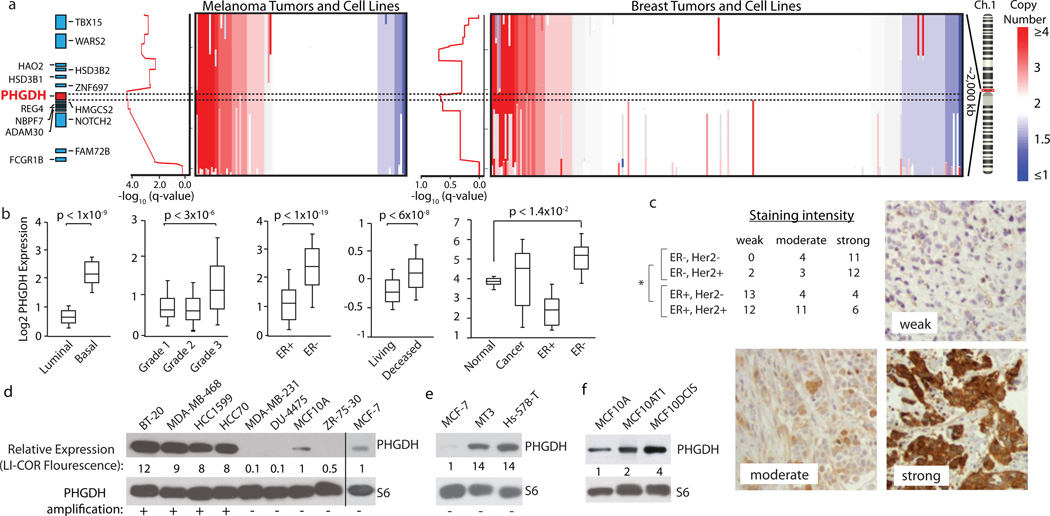
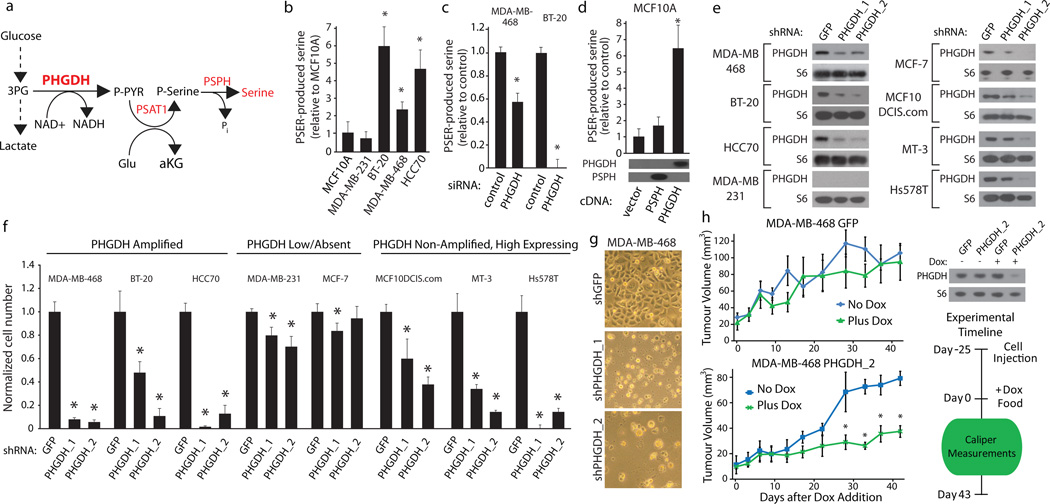
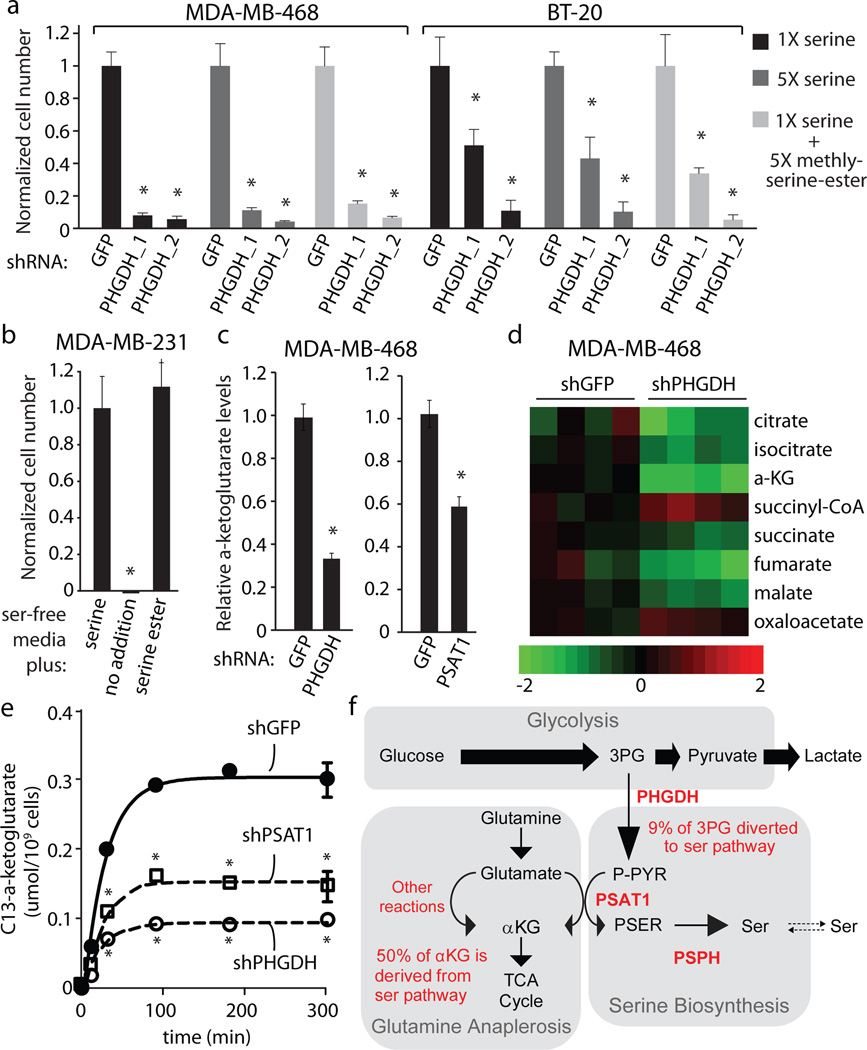
Cancer cells adapt their metabolic processes to drive macromolecular biosynthesis for rapid cell growth and proliferation. RNA interference (RNAi)-based loss-of-function screening has proven powerful for the identification of new and interesting cancer targets, and recent studies have used this technology in vivo to identify novel tumour suppressor genes. Here we developed a method for identifying novel cancer targets via negative-selection RNAi screening using a human breast cancer xenograft model at an orthotopic site in the mouse. Using this method, we screened a set of metabolic genes associated with aggressive breast cancer and stemness to identify those required for in vivo tumorigenesis. Among the genes identified, phosphoglycerate dehydrogenase (PHGDH) is in a genomic region of recurrent copy number gain in breast cancer and PHGDH protein levels are elevated in 70% of oestrogen receptor (ER)-negative breast cancers. PHGDH catalyses the first step in the serine biosynthesis pathway, and breast cancer cells with high PHGDH expression have increased serine synthesis flux. Suppression of PHGDH in cell lines with elevated PHGDH expression, but not in those without, causes a strong decrease in cell proliferation and a reduction in serine synthesis. We find that PHGDH suppression does not affect intracellular serine levels, but causes a drop in the levels of α-ketoglutarate, another output of the pathway and a tricarboxylic acid (TCA) cycle intermediate. In cells with high PHGDH expression, the serine synthesis pathway contributes approximately 50% of the total anaplerotic flux of glutamine into the TCA cycle. These results reveal that certain breast cancers are dependent upon increased serine pathway flux caused by PHGDH overexpression and demonstrate the utility of in vivo negative-selection RNAi screens for finding potential anticancer targets.


Figures

Figure 1
Figure 1. Outline of in vivo pooled screening strategy identifying PHGDH as essential for tumourigenesis
a, Venn Diagram outlining meta-analysis. b, Outline of experimental design. c, Log2 fold change in shRNAs abundance of experimental (blue) or neutral shRNAs (red) for a single tumour (X-axis) compared to an average of eleven tumours (Y-axis). d, Genes scoring in vivo. e, Average weight of tumours from MCF10DCIS.com cells expressing shRNAs targeting PHGDH (PHGDH_1, PHGDH_2 and PHGDH_3) or control (GFP) and protein expression of PHGDH or RPS6 (S6). Error bars are SEM (n=4). Asterisks indicate probability value (p) < 0.05. ND = Not Done.
Figure 2
Figure 2. Genomic amplifications of PHGDH in cancer and association of PHGDH expression with aggressive breast cancer markers
a, PHGDH vicinity copy number (CN) data for melanoma (left, n=111) and breast cancer (BC, right, n=243) samples. Coloured bar indicates degree of CN loss (blue) or gain (red). Samples sorted by CN at PHGDH locus (dotted lines). Graphs at left of CN data shows amplification significance (−log10(q-value), ~0.60 is the significance threshold for amplification). b, Representative PHGDH gene expression data for indicated BC groups. Whiskers indicate 91st and 9th percentile. c, Table reports numbers of human BC samples with “weak”, “moderate”, or “strong” PHGDH staining from BC subgroups indicated. Representative staining intensities shown in images. Asterisk indicates p<0.0001 comparing ER-positive versus ER-negative classes (Fisher’s exact test). d–f, PHGDH protein levels are shown for (d) PHGDH amplified versus non-amplified (annotated with “+” or “−“), (e) PHGDH non-amplified, over-expressing, and (f) MCF10A derived cell lines. Values below PHGDH immunoblots are normalized immunoflourescent quantification (LI-COR) of PHGDH levels relative to actin control and MCF10A and MCF7.
Figure 3
Figure 3. Cell lines with elevated PHGDH expression have increased serine biosynthetic pathway activity and are sensitive to PHGDH suppression
a, Serine biosynthesis pathway (SBP). b–d, Serine production by SBP in (b) indicated breast cell lines, (c) after PHGDH suppression by siRNA, and (d) MCF-10A cells expressing PHGDH or PSPH cDNAs with associated immunoblots. e–f, Immunoblots of indicated proteins (e) for indicated cell lines expressing control shRNA (GFP) or shRNAs against PHGDH (PHGDH_1 and PHGDH_2). Relative proliferation (f) of cells transduced with shRNA constructs after seven days. g, Images showing cellular morphology of MDA-MB-468 at day seven of (f). h, Tumour growth of MDA-MB-468 cells expressing doxycycline inducible control shRNA (GFP) or shRNA against PHGDH (shPHGDH_2) in mice fed doxycycline (Dox, 2mg/kg, green lines, n=5) or normal (blue lines, n=4) diet after initial tumour palpation (Day 0). Immunoblots of PHGDH or RPS6 (S6) shown for cells in vitro. Asterisks indicate p < 0.05 relative to control. Error bars for metabolite measurements (n=4) and tumour size indicate SEM and for cell number indicate SD (n=3).
Figure 4
Figure 4. Suppression of PHGDH results a deficiency in anaplerosis of glutamine to alpha-ketoglutarate
a, Relative proliferation of cell lines indicated expressing control shRNA (GFP) or shRNAs against PHGDH (PHGDH_1 and PHGDH_2) after seven days of growth under conditions indicated. b, Relative proliferation of MDA-MB-231 cells under conditions indicated. c, Intracellular alpha-ketoglutarate (aKG) four days after treatment with shRNA against PHGDH or PSAT1 cell number normalized relative to control shRNA (GFP). d, Citric acid cycle intermediate levels four days after treatment with shRNA against PHGDH or GFP (n=4). Color bar shows Log2 scale. e, aKG isotopic labeling at indicated time points after treatment with isotopically labeled glutamine four days after treatment with shRNA against PHGDH, PSAT1 or GFP. f, Model of relative metabolite fluxes for indicated pathways. Asterisks indicate p < 0.05 relative to control. Error bars indicate SEM (n=4).

Comment in

References

    1. Jones RG, Thompson CB. Tumor suppressors and cell metabolism: a recipe for cancer growth. Genes Dev. 2009;23(5):537–548. - PMC - PubMed
    1. Hsu PP, Sabatini DM. Cancer cell metabolism: Warburg and beyond. Cell. 2008;134(5):703–707. - PubMed
    1. Bric A, et al. Functional identification of tumor-suppressor genes through an in vivo RNA interference screen in a mouse lymphoma model. Cancer Cell. 2009;16(4):324–335. - PMC - PubMed
    1. Moffat J, et al. A lentiviral RNAi library for human and mouse genes applied to an arrayed viral high-content screen. Cell. 2006;124(6):1283–1298. - PubMed
    1. Miller FR, Santner SJ, Tait L, Dawson PJ. MCF10DCIS.com xenograft model of human comedo ductal carcinoma in situ. J Natl Cancer Inst. 2000;92(14):1185–1186. - PubMed

Publication types

MeSH terms