. 2011;6(6):e21612.
doi: 10.1371/journal.pone.0021612. Epub 2011 Jun 27.

Tracking the unconscious generation of free decisions using ultra-high field fMRI

Affiliations

Tracking the unconscious generation of free decisions using ultra-high field fMRI

Stefan Bode et al. PLoS One. 2011.

Abstract

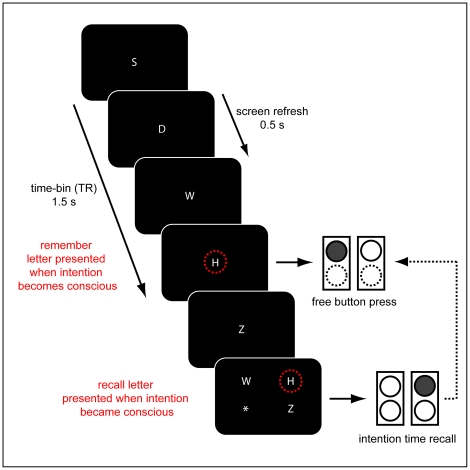
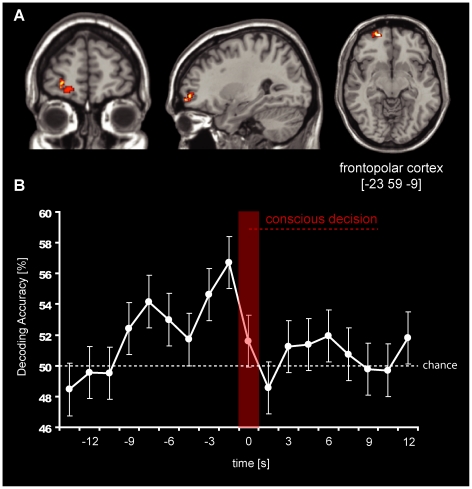
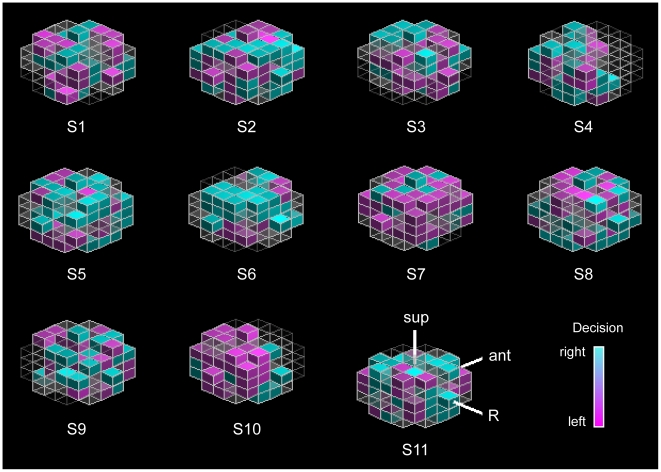
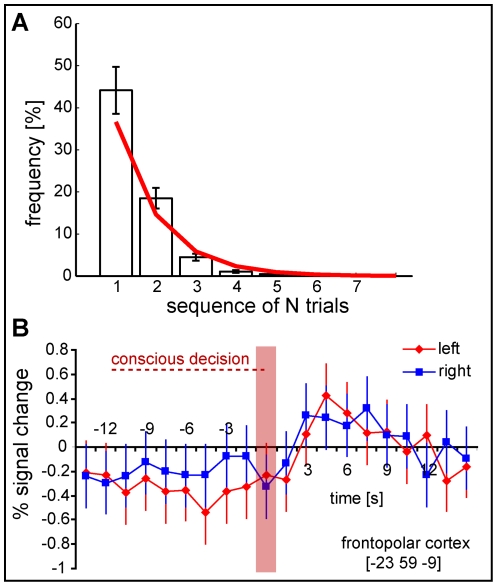
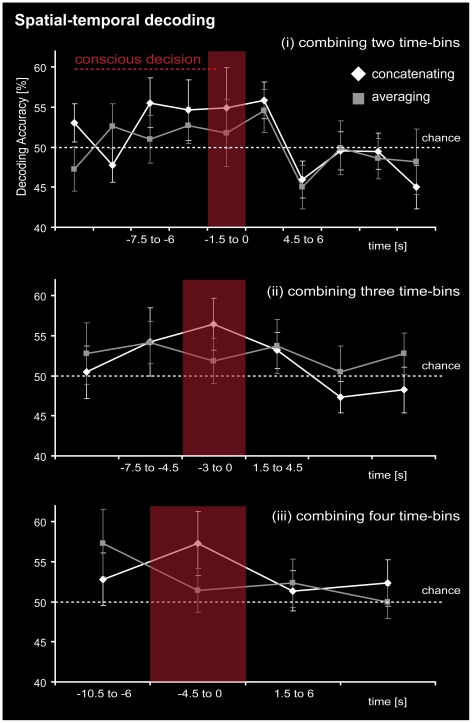
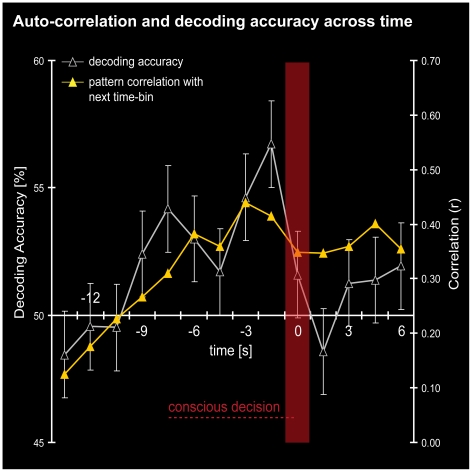
Recently, we demonstrated using functional magnetic resonance imaging (fMRI) that the outcome of free decisions can be decoded from brain activity several seconds before reaching conscious awareness. Activity patterns in anterior frontopolar cortex (BA 10) were temporally the first to carry intention-related information and thus a candidate region for the unconscious generation of free decisions. In the present study, the original paradigm was replicated and multivariate pattern classification was applied to functional images of frontopolar cortex, acquired using ultra-high field fMRI at 7 Tesla. Here, we show that predictive activity patterns recorded before a decision was made became increasingly stable with increasing temporal proximity to the time point of the conscious decision. Furthermore, detailed questionnaires exploring subjects' thoughts before and during the decision confirmed that decisions were made spontaneously and subjects were unaware of the evolution of their decision outcomes. These results give further evidence that FPC stands at the top of the prefrontal executive hierarchy in the unconscious generation of free decisions.


Conflict of interest statement

Competing Interests: The authors have declared that no competing interests exist.

Figures

Figure 1
Figure 1. Experimental paradigm.
Subjects were presented with a stream of constantly changing white letters on dark background. The screen was refreshed every 500 ms. The task was to freely and spontaneously decide to press a response button with the left or the right index finger (illustrated by upper circles; decision for left button in example illustrated by filled circle) whenever they felt the urge to do so. They were instructed to note the letter displayed on the screen when they became aware of their intention and to immediately perform the button press (the letter H in the example; red circles are for illustration and were not presented). Following the button press, a response screen was presented. Three letters and an asterisk were presented in the four corners of the screen, the letters being those shown during and immediately prior to the button press. Subjects indicated the letter that was visible at the time of the decision by pressing the button corresponding to its position on screen (recalled letter H, indicated by upper right button in example). If they could not remember the letter or if the relevant letter was not present, they indicated this with the asterisk. After the response was given, the next trial started and subjects were instructed to return to a relaxed state before making a new decision. The general paradigm was taken from Soon et al. .
Figure 2
Figure 2. Illustration of EPI image, slice positioning and decoding approach.
A) Example of one slice of one participant's EPI image. B) Structural T1 image from the same subject displaying the positioning of the example slice (dotted line) and slice coverage (blue box). For each subject, 21–25 coronal slices (1×1×1 mm3, without gap) were positioned such that the most anterior part of frontopolar cortex was covered. Due to the optimized slice positioning, which allowed the use of a small field of view (FOV) and a short echo train length, a relative small part of the air-filled cavities was included. This improved the quality of the EPIs and reduced signal dropouts and distortions. C) The parameter estimates from the FIR model were used for multivariate pattern classification. A moving “searchlight” algorithm was implemented using a radius of 3 voxels in order to decode the outcome of the upcoming decision from each position in frontopolar cortex.
Figure 3
Figure 3. Decoding of upcoming motor decisions from frontopolar cortex.
A) The figure displays a region in left frontopolar cortex [−23 59 −9] from which decoding was possible significantly above chance (50%) using a threshold of p<.05 (FDR corrected; voxel-threshold 5 voxels). FPC only showed significant decoding accuracies in the time-bins preceding the decision. B) The graph displays the average time-course of decoding accuracies, taken from the central voxel of the searchlight cluster that showed the highest decoding accuracy. Error bars represent standard errors. The time-bin of the conscious intention is indicated by the red bar and is labelled as time 0. Time-points preceding the conscious awareness of the intention are labelled as negative numbers (units = seconds, relative to decision); time-points following the decision are therefore positive. One time-bin corresponds to 1.5 s. Coordinates displayed are MNI coordinates.
Figure 4
Figure 4. Individual searchlight clusters.
Displayed are the spherical voxel clusters (with radius r = 3 voxels) in frontopolar cortex of all subject that yielded the highest decoding accuracy in the time-bin directly preceding the decision (−1.5 s). Voxels responding preferentially to one decision are colour-coded (magenta for left, aqua for right; sup = superior, ant = anterior, R = right). Grey transparent voxels did not show decision preference or were not located in grey matter. Colours are scaled for better visualization. Informative patterns were different for each participant.
Figure 5
Figure 5. Sequence length and univariate fMRI results.
A) Histogram of sequence length. Displayed is the average percentage of sequences of N trials of the same decision (left or right) before switching to the other decision. It resembles an exponential distribution; fitted model: f(x) = 100*c*e−c*x, with c = 0.917, RMSD = 2.739 (red curve). This suggests that subjects made random decisions. Error bars are standard errors. B) The graph shows the percent signal change (average BOLD estimates from 20 FIR predictors) during left-decision and right-decision trials for the central searchlight voxel [−23 59 −9] that demonstrated the highest accuracy in decoding the decision outcome prior to the conscious decision. For both conditions, the signal increased only after the decision (red bar) and came back down to baseline in the next ten seconds. Significant differences between left and right decisions were not found for this cluster. No region could be found in the imaged volume that displayed a difference between left and right, even when a liberal threshold of p<.001 (uncorrected) was used. Time-points preceding the conscious awareness of the intention are labelled as negative numbers (units = seconds, relative to decision); time-points following the decision are therefore positive. One time-bin corresponds to 1.5 s. Coordinates are given as MNI coordinates.
Figure 6
Figure 6. Temporal pattern stability.
Temporal-spatial decoding analysis. The spatial activation patterns from the searchlight cluster, which was found to give best results in decoding accuracy (MNI −23 59 −9), was extracted in the individual subjects' data. The original patterns from the time-bins (1 time-bin = 1.5 s) were combined by concatenating (white) and averaging (grey) the respective pattern vectors in steps of either (i) two time-bins, (ii) three time-bins, or (iii) four time-bins. The reference time-bin for vector concatenation was the time point of the decision (time 0 s). The resulting pattern vectors additionally represented temporal information for the best searchlight cluster and were used for multivariate decoding. Temporal-spatial information was found to be highest directly preceding the decision and was still present when four time bins were concatenated. Concatenating was superior to averaging by trend.
Figure 7
Figure 7. Correlation analysis for spatial activation patterns.
Displayed is the decoding accuracy across time from the best cluster (empty gray triangles) as well as the correlation of each time-bin with its preceding time-bin (filled yellow triangles) as a measure of pattern similarity (averaged across patterns for left and right decisions). Up to the time of the decision (time 0 s) the decoding accuracy and pattern similarity increased in a similar fashion. After the decision, the pattern similarity dropped slightly and patterns did not predict the decision outcome anymore.

References

    1. Wegner DM. The mind's best trick: how we experience conscious will. Trends Cogn Sci. 2003;7:65–69. - PubMed
    1. Haggard P. Conscious intention and motor cognition. Trends Cogn Sci. 2005;9:290–295. - PubMed
    1. Custers R, Aarts H. The unconscious will: how the pursuit of goals operates outside of conscious awareness. Science. 2010;329:47–50. - PubMed
    1. Kornhuber HH, Deecke L. Hirnpotentialänderungen bei Willkürbewegungen und passiven Bewegungen des Menschen: Bereitschaftspotential und reafferente Potentiale. Pflüglers Arch für die gesamte Phys des Menschen u der Tiere. 1965;284:1–17. - PubMed
    1. Libet B, Gleason CA, Wright EW, Pearl DK. Time of conscious intention to act in relation to onset of cerebral activities (readiness-potential): the unconscious initiation of a freely voluntary act. Brain. 1983;106:623–642. - PubMed

Publication types