

Differences between human plasma and serum metabolite profiles
- PMID: 21760889
- PMCID: PMC3132215
- DOI: 10.1371/journal.pone.0021230
Differences between human plasma and serum metabolite profiles
Abstract
Background: Human plasma and serum are widely used matrices in clinical and biological studies. However, different collecting procedures and the coagulation cascade influence concentrations of both proteins and metabolites in these matrices. The effects on metabolite concentration profiles have not been fully characterized.
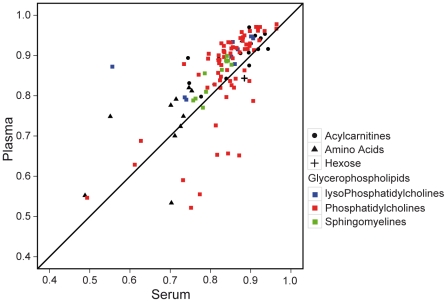
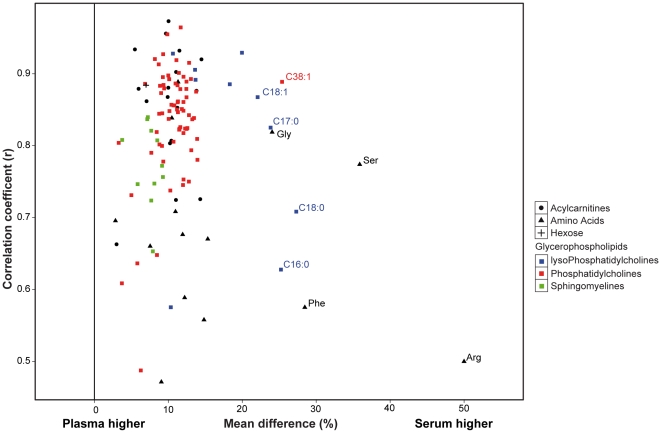
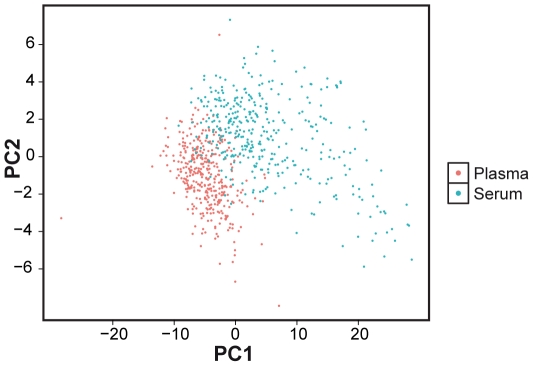
Methodology/principal findings: We analyzed the concentrations of 163 metabolites in plasma and serum samples collected simultaneously from 377 fasting individuals. To ensure data quality, 41 metabolites with low measurement stability were excluded from further analysis. In addition, plasma and corresponding serum samples from 83 individuals were re-measured in the same plates and mean correlation coefficients (r) of all metabolites between the duplicates were 0.83 and 0.80 in plasma and serum, respectively, indicating significantly better stability of plasma compared to serum (p = 0.01). Metabolite profiles from plasma and serum were clearly distinct with 104 metabolites showing significantly higher concentrations in serum. In particular, 9 metabolites showed relative concentration differences larger than 20%. Despite differences in absolute concentration between the two matrices, for most metabolites the overall correlation was high (mean r = 0.81±0.10), which reflects a proportional change in concentration. Furthermore, when two groups of individuals with different phenotypes were compared with each other using both matrices, more metabolites with significantly different concentrations could be identified in serum than in plasma. For example, when 51 type 2 diabetes (T2D) patients were compared with 326 non-T2D individuals, 15 more significantly different metabolites were found in serum, in addition to the 25 common to both matrices.
Conclusions/significance: Our study shows that reproducibility was good in both plasma and serum, and better in plasma. Furthermore, as long as the same blood preparation procedure is used, either matrix should generate similar results in clinical and biological studies. The higher metabolite concentrations in serum, however, make it possible to provide more sensitive results in biomarker detection.
Conflict of interest statement
Figures
References
-
- Jaffe AS, Ravkilde J, Roberts R, Naslund U, Apple FS, et al. It's Time for a Change to a Troponin Standard. Circulation. 2000;102:1216–1220. - PubMed
-
- Sacks DB, Bruns DE, Goldstein DE, Maclaren NK, McDonald JM, et al. Guidelines and Recommendations for Laboratory Analysis in the Diagnosis and Management of Diabetes Mellitus. Clin Chem. 2002;48:436–472. - PubMed
-
- Mannello F. Serum or Plasma Samples? The “Cinderella” Role of Blood Collection Procedures Preanalytical Methodological Issues Influence the Release and Activity of Circulating Matrix Metalloproteinases and Their Tissue Inhibitors, Hampering Diagnostic Trueness and Leading to Misinterpretation. Arterioscler Thromb Vasc Biol. 2008;28:611–614. doi: 10.1161/ATVBAHA.107.159608. - DOI - PubMed
-
- Schnabel RB, Baumert J, Barbalic M, Dupuis J, Ellinor PT, et al. Duffy antigen receptor for chemokines (Darc) polymorphism regulates circulating concentrations of monocyte chemoattractant protein-1 and other inflammatory mediators. Blood. 2009 blood-2009-05-221382. doi:10.1182/blood-2009-05-221382. - PMC - PubMed
-
- Yatomi Y, Igarashi Y, Yang L, Hisano N, Qi R, et al. Sphingosine 1-Phosphate, a Bioactive Sphingolipid Abundantly Stored in Platelets, Is a Normal Constituent of Human Plasma and Serum. J Biochem. 1997;121:969–973. - PubMed
Publication types
MeSH terms
LinkOut - more resources
Full Text Sources
Other Literature Sources
Miscellaneous
