. 2011;6(7):e21488.
doi: 10.1371/journal.pone.0021488. Epub 2011 Jul 8.

Pattern-dependent response modulations in motion-sensitive visual interneurons--a model study

Affiliations

Pattern-dependent response modulations in motion-sensitive visual interneurons--a model study

Hanno Gerd Meyer et al. PLoS One. 2011.

Abstract

Even if a stimulus pattern moves at a constant velocity across the receptive field of motion-sensitive neurons, such as lobula plate tangential cells (LPTCs) of flies, the response amplitude modulates over time. The amplitude of these response modulations is related to local pattern properties of the moving retinal image. On the one hand, pattern-dependent response modulations have previously been interpreted as 'pattern-noise', because they deteriorate the neuron's ability to provide unambiguous velocity information. On the other hand, these modulations might also provide the system with valuable information about the textural properties of the environment. We analyzed the influence of the size and shape of receptive fields by simulations of four versions of LPTC models consisting of arrays of elementary motion detectors of the correlation type (EMDs). These models have previously been suggested to account for many aspects of LPTC response properties. Pattern-dependent response modulations decrease with an increasing number of EMDs included in the receptive field of the LPTC models, since spatial changes within the visual field are smoothed out by the summation of spatially displaced EMD responses. This effect depends on the shape of the receptive field, being the more pronounced--for a given total size--the more elongated the receptive field is along the direction of motion. Large elongated receptive fields improve the quality of velocity signals. However, if motion signals need to be localized the velocity coding is only poor but the signal provides--potentially useful--local pattern information. These modelling results suggest that motion vision by correlation type movement detectors is subject to uncertainty: you cannot obtain both an unambiguous and a localized velocity signal from the output of a single cell. Hence, the size and shape of receptive fields of motion sensitive neurons should be matched to their potential computational task.


Conflict of interest statement

Competing Interests: The authors have declared that no competing interests exist.

Figures

Figure 1
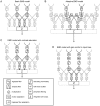
Figure 1. EMD array models used for simulation of LPTC response.
(A) Basic EMD model including peripheral filtering (PF) in the input stage (see Methods and Materials). Signals from each receptor are delayed via the phase delay of a temporal first-order low-pass filter, multiplied and half-wave rectified. Integration of signals in the output cell Z is performed according to the gain control model . (B) Adaptive EMD model extended with a first-order high-pass filter in the cross-arms of the half-detectors. The time-constant of the high-pass filter is adjusted according to the rate of change of the corresponding low-pass signal . (C) EMD model with contrast saturation during early visual processing in the input stage. Saturating non-linearities are included to mimic contrast saturation during early visual processing . (D) EMD model with gain control in the input lines . The input from each receptor channel is divided by the mean absolute deviation (see Methods and Materials) in order to control the gain in the input lines.
Figure 2
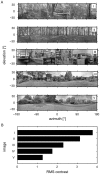
Figure 2. High dynamic range panorama images.
(A) Five different panoramic high dynamic range photographs used as input datasets. Images have been normalized, gamma corrected and reduced to 8-bit dynamic range for reproduction. (B) Global root mean square (RMS/see Methods and Materials) contrast for each image. RMS contrast varies considerably between images.
Figure 3
Figure 3. Pattern dependent response modulations of EMD models.
(A) Image III (Fig. 2A) sampled by a one-dimensional EMD array, with either 2 (blue) or 4 (blue and red) receptors integrated. Image translates horizontally for 300 ms with a speed of 60°/s in preferred direction. (B) Normalized EMD responses Z for all models (Fig.1A–D) corresponding to the marked region in the input image. Blue response traces correspond to an EMD array integrating 2 receptors and pink response traces to an array integrating 4 receptors. pattern-dependent modulation amplitude and temporal response characteristics differ between models.
Figure 4
Figure 4. Pattern-dependent modulations of EMD models with one-dimensional receptive fields.
(A) Panoramic high dynamic range input image II (Fig. 2) used exemplarily for stimulation. (B) Logarithmic color coded standard deviation describing the mean pattern-dependent modulation for one-dimensional receptive fields differing in vertical receptor position and azimuthal receptive field size (# of receptors included horizontally) for all models. In all models pattern-dependent modulation amplitude decreases with horizontal receptive field extent. With increasing receptive field extent pattern-dependent modulations are reduced to a higher extent in models with contrast saturation (C&D). Further, pattern-dependent modulation amplitude depends on the contrast distribution of the input image, as can be seen, when comparing pattern-dependent modulation amplitudes corresponding to the upper (trees) and lower part (ground) of the input image.
Figure 5
Figure 5. Pattern-dependent modulations of EMD models with two-dimensional receptive fields.
(A) Panoramic high dynamic range input image used exemplarily for stimulation. (B) Color coded standard deviation describing the mean pattern-dependent modulation for two-dimensional receptive field arrays for all models. Receptive field size is defined via the number of receptors included in the integration of EMD signals in elevation and azimuth. Two-dimensional receptive fields are achieved by expansion of a one-dimensional receptive field located at the center of horizon in its vertical and horizontal size. The iso-line describes exemplarily receptive field sizes with 10 receptors included. The cross corresponds to a square receptive field (m = n) with 256 receptors included.
Figure 6
Figure 6. Mean pattern-dependent modulations for one- and two-dimensional EMD array responses.
Mean pattern-dependent modulations over all input images for the different (color-coded) models: blue  =  Basic EMD model, green  =  Adaptive EMD model, red  =  EMD model with contrast saturation and yellow  =  EMD model with gain control in the input lines. Solid lines correspond to pattern-dependent modulations of one-dimensional EMD array responses, symbols correspond to responses of square EMD arrays. Mean pattern-dependent modulations decay stronger with increasing receptive field extent in one-dimensional EMD arrays, compared to square arrays. Black dashed line indicates receptive field size with 256 receptors integrated.
Figure 7
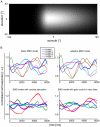
Figure 7. EMD array responses with an estimated HSE cell receptive field.
(A) Weight field estimate of the spatial sensitivity distribution of a model HSE cell. The brighter the gray level the larger the local weight of the corresponding EMDs and, thus, the spatial sensitivity. The frontal equatorial viewing direction is at 0° azimuth and 0° elevation. (B) Normalized response traces of HSE models with the four types of EMD variants as indicated in the figure. Image motion was performed for 12s in preferred direction with an angular velocity of 60°/s. Responses to all image datasets are shown.

Similar articles

Cited by

References

    1. Lappe M. Neuronal Processing of Optic Flow. Elsevier. 1999;44
    1. Egelhaaf M. The neural computation of visual motion information. Invertebrate Vision. 2006. pp. 399–461.
    1. Reichardt W. Autocorrelation, a principle for the evaluation of sensory information by the central nervous system. In: Rosenblith WA, editor. Sensory Communication. M.I.T. Press; Wiley, J.& Sons; 1961. pp. 303–317.
    1. Egelhaaf M, Borst A, Reichardt W. Computational structure of a biological motion-detection system as revealed by local detector analysis in the fly's nervous system. Journal of the Optical Society of America A: Optics and Image Science. 1989;6:1070–1087. - PubMed
    1. Egelhaaf M, Borst A. Movement detection in arthropods. Reviews of Oculomotor Research. 1993;5:53–77. - PubMed

Publication types