An evaluation protocol for subtype-specific breast cancer event prediction
- PMID: 21760900
- PMCID: PMC3132736
- DOI: 10.1371/journal.pone.0021681
An evaluation protocol for subtype-specific breast cancer event prediction
Abstract
In recent years increasing evidence appeared that breast cancer may not constitute a single disease at the molecular level, but comprises a heterogeneous set of subtypes. This suggests that instead of building a single monolithic predictor, better predictors might be constructed that solely target samples of a designated subtype, which are believed to represent more homogeneous sets of samples. An unavoidable drawback of developing subtype-specific predictors, however, is that a stratification by subtype drastically reduces the number of samples available for their construction. As numerous studies have indicated sample size to be an important factor in predictor construction, it is therefore questionable whether the potential benefit of subtyping can outweigh the drawback of a severe loss in sample size. Factors like unequal class distributions and differences in the number of samples per subtype, further complicate comparisons. We present a novel experimental protocol that facilitates a comprehensive comparison between subtype-specific predictors and predictors that do not take subtype information into account. Emphasis lies on careful control of sample size as well as class and subtype distributions. The methodology is applied to a large breast cancer compendium involving over 1500 arrays, using a state-of-the-art subtyping scheme. We show that the resulting subtype-specific predictors outperform those that do not take subtype information into account, especially when taking sample size considerations into account.
Conflict of interest statement
Figures

 and a validation set
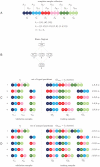
  . For each set separately various partitions are created. The yellow dashed line illustrates the strict separation of training (top) and validation (bottom) parts. 3) the most refined partition involves a single subtype per part. The typed version (tp) partitions
  by parts stratified by class label and subtype. The untyped (un) counterpart involves parts stratified by class label only, however, each untyped part involves an identical number of positive and negative training samples as its typed counterpart. Here lighter (darker) open circles represent positive (negative) cases. Alternative partitions can be constructed by pooling some or all of the initial parts, as depicted in 4) and 5). On each training part a separate predictor is constructed, which is evaluated on a specific set of validation samples. Note that paired typed and untyped predictors are evaluated on the same set of validation samples. 5) presents a special case for which typed and untyped training sets are identical and equal the overall training set
  . This set is used to construct the baseline predictor. The untyped predictors associated with partitions 1 and 2 represent down-scaled versions of the baseline and serve to assess the influence of sample size.
 , representing the subtypes lumA, lumB, Her2, and basal, respectively. White ovals indicate parts. The lines represent a move from one partition to another by either merging two parts (bottom to top) or splitting one part into two parts (top to bottom). The top layer depicts the coarsest partition in which all elementary types have been pooled into a single part, making it essentially untyped. The bottom layer represents the most refined partition, i.e. one part for each elementary subtype. For each distinct part a separate predictor is constructed. The partition in the top layer is used for baseline predictor construction. In this example
  ,
,  ,
,  and
and  .
.

 and a validation set
  . 2) Construction of typed training sets
  ,
,  and
and  . 3) Construction of untyped training sets
  ,
,  and
and  . 4) Baseline predictor construction. 5) Typed predictor construction. 6) Untyped predictor construction. 7) Stratification of validation set by subtype. 8) Invoke baseline predictor on validation samples. 9) Invoke typed predictors on associated validation samples. 10) Invoke matching untyped predictors on same validation sets. Steps 1–10 are repeated for all folds
  . 11–13) Subtype-specific performance estimation based on the aggregated event predictions (over all folds) per subtype, as made by the baseline (11), typed (12), and untyped (13) predictors. 14–16) Overall performance estimation based on the aggregated event predictions over all folds made by the baseline (14), typed (15), and untyped (16) predictors.
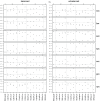
 , that represents the subtypes lumA, lumB, Her2 and basal, respectively (Figure 2). The left panel corresponds to experiments involving the balanced compendia
  , while the right panel corresponds to experiments involving the full unbalanced compendium
  . In each panel the top numbers
  indicate the number of different parts in each of the partitions, while the bottom line identifies the precise makeup of the various partitions e.g. the notation B
 H
H La.Lb indicates a partition into three parts, involving separate basal and Her2 groups, while having a combined luminal group. In each panel the coarsest partition is situated at the outer left, which corresponds to the baseline predictor (indicated in bold), that is, a single predictor that targets all samples. The most refined partition is situated at the outer right, which uses a separate predictor for each elementary subtype. A horizontal dotted line indicates the performance of the baseline predictors. Vertical dotted lines are used to group the partitions by their number of parts, as indicated by the top numbers. Results represent averages over 100 repeats. Rows represent seven frequently used performance indicators: area under curve (auc), balanced accuracy (bar), sensitivity (sen), specificity (spc), accuracy (acc), positive predictive value (ppv) and negative predictive value (npv). Performance for typed predictors is indicated with a dot, performance for untyped predictors with a cross.
Similar articles
-
Breast cancer subtype predictors revisited: from consensus to concordance?BMC Med Genomics. 2016 Jun 3;9(1):26. doi: 10.1186/s12920-016-0185-6. BMC Med Genomics. 2016. PMID: 27259591 Free PMC article.
-
Correlation of microarray-based breast cancer molecular subtypes and clinical outcomes: implications for treatment optimization.BMC Cancer. 2011 Apr 18;11:143. doi: 10.1186/1471-2407-11-143. BMC Cancer. 2011. PMID: 21501481 Free PMC article. Clinical Trial.
-
Module-based outcome prediction using breast cancer compendia.PLoS One. 2007 Oct 17;2(10):e1047. doi: 10.1371/journal.pone.0001047. PLoS One. 2007. PMID: 17940611 Free PMC article.
-
Breast cancer prognosis signature: linking risk stratification to disease subtypes.Brief Bioinform. 2019 Nov 27;20(6):2130-2140. doi: 10.1093/bib/bby073. Brief Bioinform. 2019. PMID: 30184043 Review.
-
The Complex Subtype-Dependent Role of Connexin 43 (GJA1) in Breast Cancer.Int J Mol Sci. 2018 Feb 28;19(3):693. doi: 10.3390/ijms19030693. Int J Mol Sci. 2018. PMID: 29495625 Free PMC article. Review.
Cited by
-
Reuse of public genome-wide gene expression data.Nat Rev Genet. 2013 Feb;14(2):89-99. doi: 10.1038/nrg3394. Epub 2012 Dec 27. Nat Rev Genet. 2013. PMID: 23269463 Review.
-
A pathway-based classification of breast cancer integrating data on differentially expressed genes, copy number variations and microRNA target genes.Mol Cells. 2012 Oct;34(4):393-8. doi: 10.1007/s10059-012-0177-0. Epub 2012 Sep 13. Mol Cells. 2012. PMID: 22983731 Free PMC article.
-
A novel network regularized matrix decomposition method to detect mutated cancer genes in tumour samples with inter-patient heterogeneity.Sci Rep. 2017 Jun 6;7(1):2855. doi: 10.1038/s41598-017-03141-w. Sci Rep. 2017. PMID: 28588243 Free PMC article.
-
A data similarity-based strategy for meta-analysis of transcriptional profiles in cancer.PLoS One. 2013;8(1):e54979. doi: 10.1371/journal.pone.0054979. Epub 2013 Jan 29. PLoS One. 2013. PMID: 23383020 Free PMC article.
-
Identifying global expression patterns and key regulators in epithelial to mesenchymal transition through multi-study integration.BMC Cancer. 2017 Jun 26;17(1):447. doi: 10.1186/s12885-017-3413-3. BMC Cancer. 2017. PMID: 28651527 Free PMC article.
References
-
- van't Veer L, Dai H, van de Vijver M, He Y, Hart A, et al. Gene expression profiling predicts clinical outcome of breast cancer. Nature. 2002;415:530. - PubMed
-
- Weigelt B, Baehner FL, Reis-Filho JS. The contribution of gene expression profiling to breast cancer classification, prognostication and prediction: a retrospective of the last decade. Journal of Pathology. 2010;220:263–280. - PubMed
-
- Perou C, Sørlie T, Eisen M, van de Rijn M, Jeffrey S, et al. Molecular portraits of human breast tumours. Nature. 2000;406:747–752. - PubMed
-
- Desmedt C, Haibe-Kains B, Wirapati P, Buyse M, Larsimont D, et al. Biological processes associated with breast cancer clinical outcome depend on the molecular subtypes. Clinical Cancer Research. 2008;14:5158. - PubMed
Publication types
MeSH terms
LinkOut - more resources
Full Text Sources
Medical
Research Materials

