. 2011 Aug;88(4):637-50.
doi: 10.1007/s11524-011-9599-9.

Help-seeking behavior during elevated temperature in Chinese population

Affiliations

Help-seeking behavior during elevated temperature in Chinese population

Emily Ying Yang Chan et al. J Urban Health. 2011 Aug.

Abstract

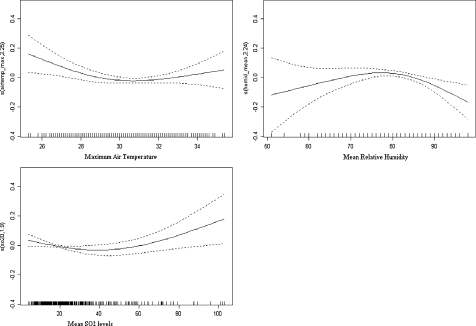
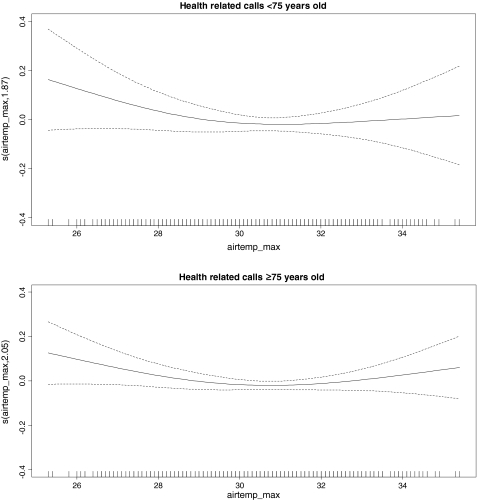
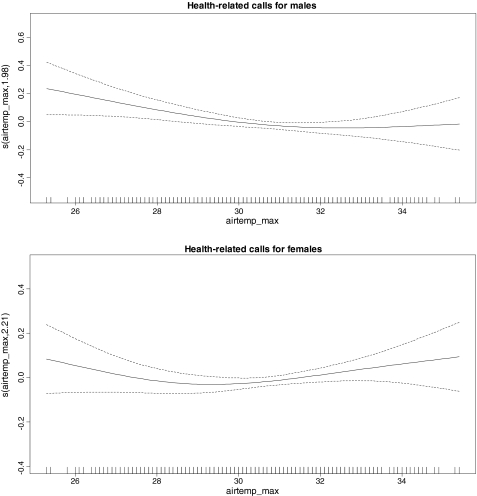
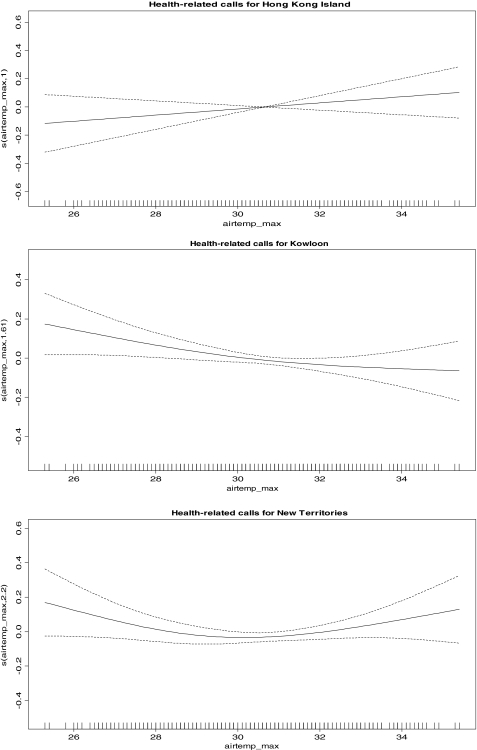
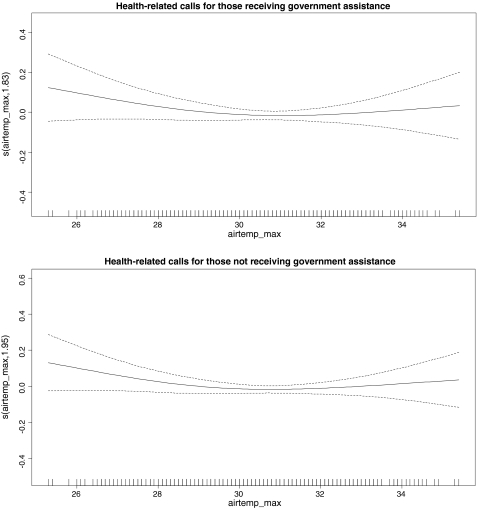
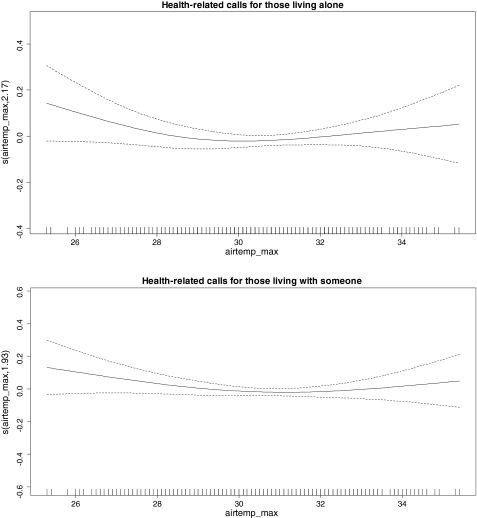
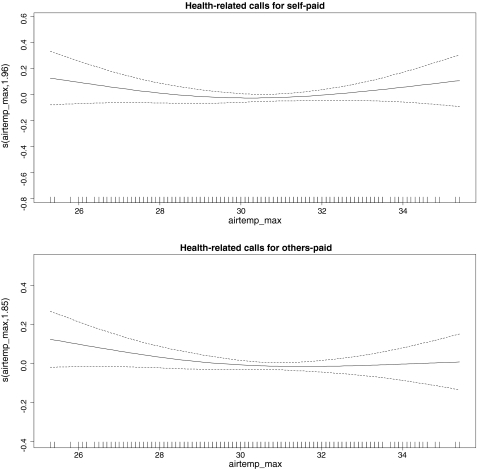
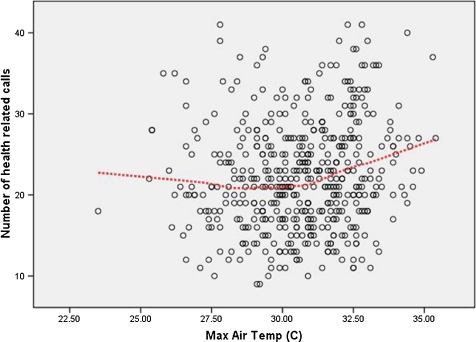
The negative impact of extreme temperatures on health is well-established. Individual help-seeking behavior, however, may mitigate the extent of morbidity and mortality during elevated temperatures. This study examines individual help-seeking behavior during periods of elevated temperatures among a Chinese population. Help-seeking patterns and factors that influence behavior will be identified so that vulnerable subgroups may be targeted for health protection during heat crises. A retrospective time-series Poisson generalized additive model analysis, using meteorological data of Hong Kong Observatory and routine emergency help call data from The Hong Kong Senior Citizen Home Safety Association during warm seasons (June-September) 1998-2007, was conducted. A "U"-shaped association was found between daily emergency calls and daily temperature. About 49% of calls were for explicit health-related reasons including dizziness, shortness of breath, and general pain. The associate with maximum temperature was statistically significant (p = 0.034) with the threshold temperature at which the frequency of health-related calls started to increase being around 30-32°C. Mean daily relative humidity (RH) also had a significant U-shaped association with daily emergency health-related calls with call frequency beginning to increase with RH greater than 70-74% (10-25% of the RH distribution). Call frequency among females appeared to be more sensitive to high temperatures, with a threshold between 28.5°C and 30.5°C while calls among males were more sensitive to cold temperatures (threshold 31.5-33.5°C). Results indicate differences in community help-seeking behavior at elevated temperatures. Potential programs or community outreach services might be developed to protect vulnerable subgroups from the adverse impact of elevated temperatures.


Figures

FIGURE 1
FIGURE 1
All health-related calls (p values: maximum air temperature p = 0.034, mean relative humidity p = 0.011, SO2 p = 0.046. During the warm seasons between 1998 and 2007, 19,865 SCHSA members made emergency calls to the PE Link, of which 10,916 were for explicitly health-related reasons). Associations between weather and SO2 and daily numbers of health-related calls. Y-axis represents the centered standardized residuals when controlling for other variables in the model. Solid line represents the smoothed mean residuals across values of the X-axis variables which describes the basic shape of the association. Dashed lines represent 95% Bayesian credible intervals.
FIGURE 2
FIGURE 2
Health-related calls by age (p values: age < 75, p = 0.21, age ≥ 75, p = 0.089).
FIGURE 3
FIGURE 3
Health-related calls by gender (p values: male p = 0.013, female = 0.087).
FIGURE 4
FIGURE 4
Health-related calls by area of residence (p value: HKI p = 0.26, Kowloon p = 0.0098, New Territories p = 0.036).
FIGURE 5
FIGURE 5
Health-related calls by socioeconomic status (p value: receiving CSSA, p = 0.21; not receiving CSSA, p = 0.15. Hong Kong government’s CSSA scheme provides supplemental income to people living below the poverty line in Hong Kong, thus representing poverty or low socioeconomic status).
FIGURE 6
FIGURE 6
Health-related calls by dependency status (p value: living alone p = 0.11, living with someone p = 0.13).
FIGURE 7
FIGURE 7
Health-related calls by access to social network (p value: paid by network p = 0.14, self-paid p = 0.17. Membership payment (by a network/organization or self-paid) used as a proxy for access to social network).
FIGURE 8
FIGURE 8
Association between daily maximum temperature and daily number of health-related calls: June–September 1998–2006 Hong Kong (line presents smoothed mean of number of calls).

Similar articles

Cited by

References

    1. Pirard P, Vandentorren S, Pascal M, et al. Summary of the mortality impact assessment of the 2003 heat wave in France. Euro Surveill. 2005;10(7):15. - PubMed
    1. Davis RE, Knappenberger PC, Michaels PJ, et al. Changing heat-related mortality in the United States. Environ Health Perspect. 2003;111(14):1712–1718. doi: 10.1289/ehp.6336. - DOI - PMC - PubMed
    1. Hajat S, Kovats RS, Atkinson RW, Haines A. Impact of hot temperatures on death in London: a time series approach. J Epidemiol Community Health. 2002;56(5):367–372. doi: 10.1136/jech.56.5.367. - DOI - PMC - PubMed
    1. Braga AL, Zanobetti A, Schwartz J. The time course of weather-related deaths. Epidemiology. 2001;12(6):662–667. doi: 10.1097/00001648-200111000-00014. - DOI - PubMed
    1. Grize L, Huss A, Thommen O, et al. Heat wave 2003 and mortality in Switzerland. Swiss Med Wkly. 2005;135(13–14):200–205. - PubMed

Publication types

LinkOut - more resources