. 2011 Aug;240(8):1889-904.
doi: 10.1002/dvdy.22685.

V-ATPase-dependent ectodermal voltage and pH regionalization are required for craniofacial morphogenesis

Affiliations

V-ATPase-dependent ectodermal voltage and pH regionalization are required for craniofacial morphogenesis

Laura N Vandenberg et al. Dev Dyn. 2011 Aug.

Abstract

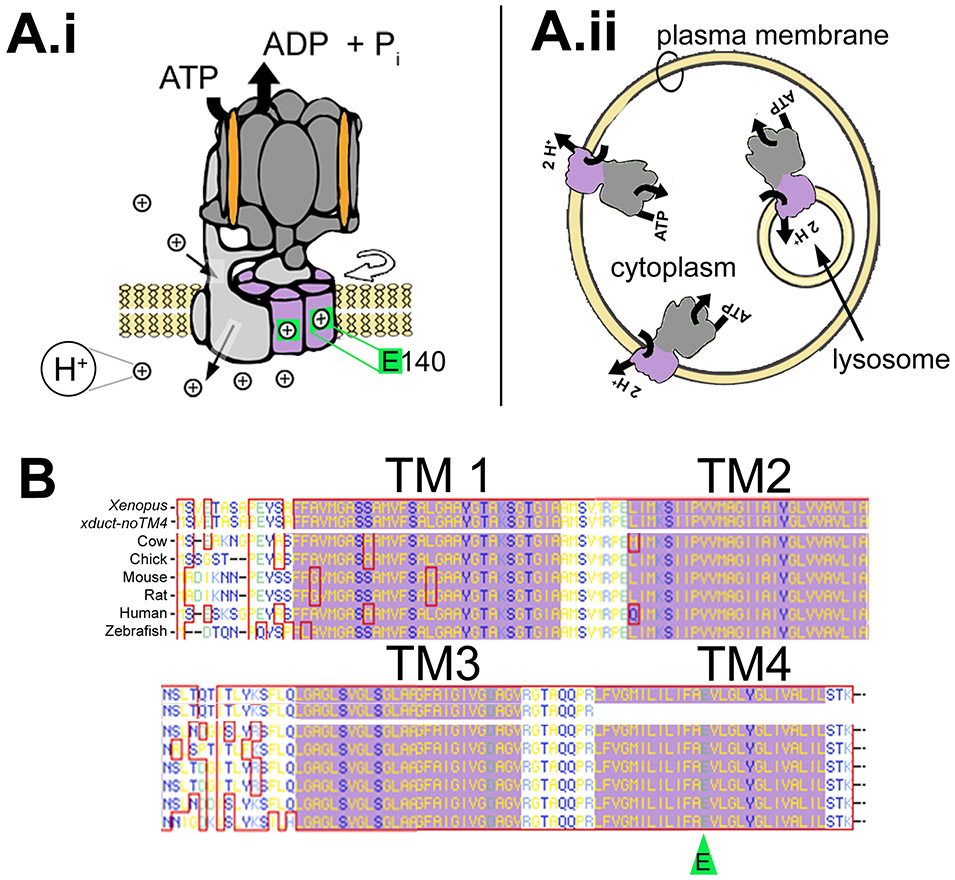
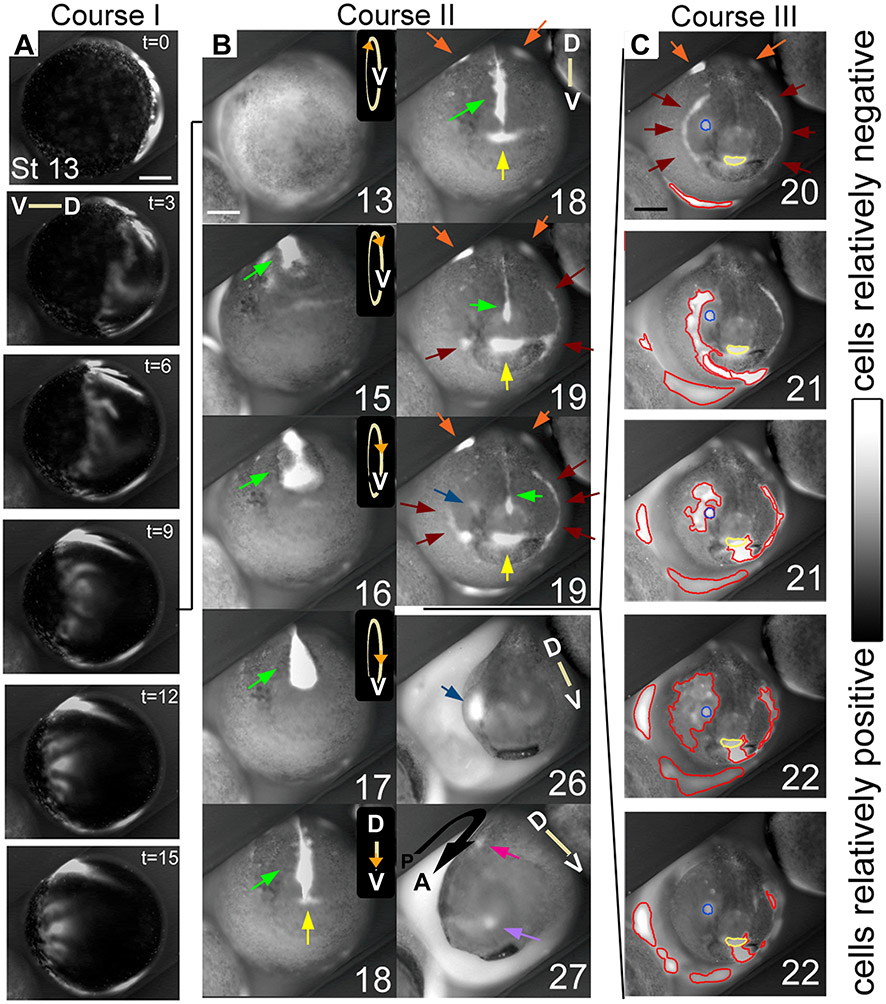
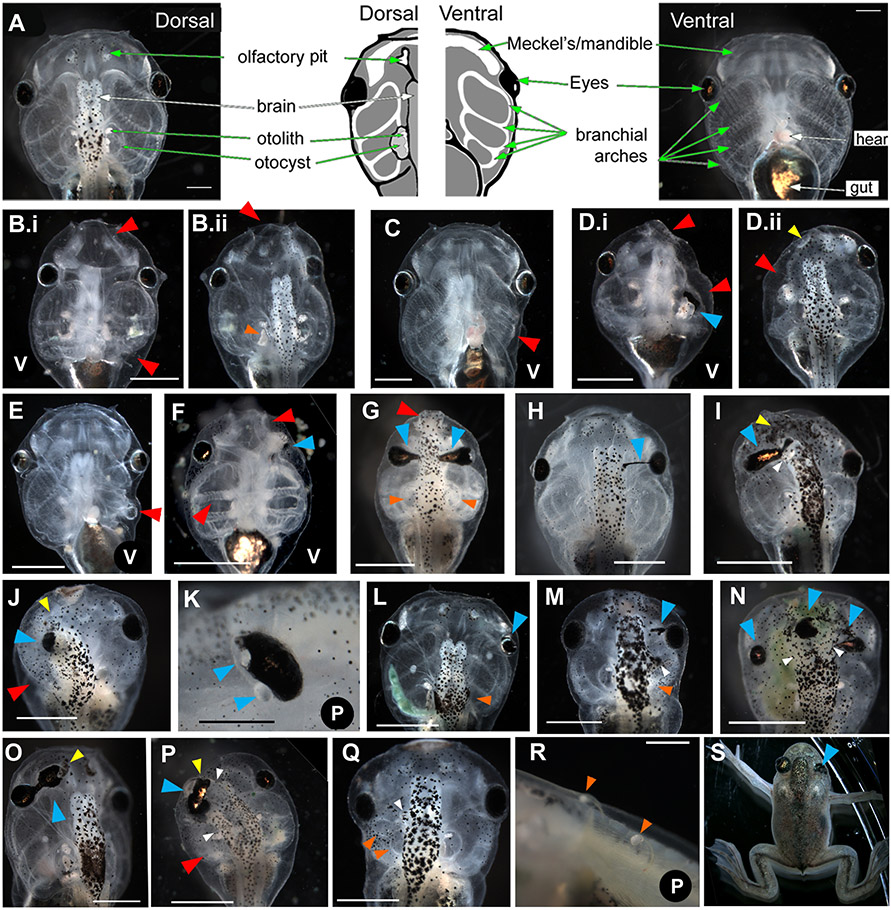
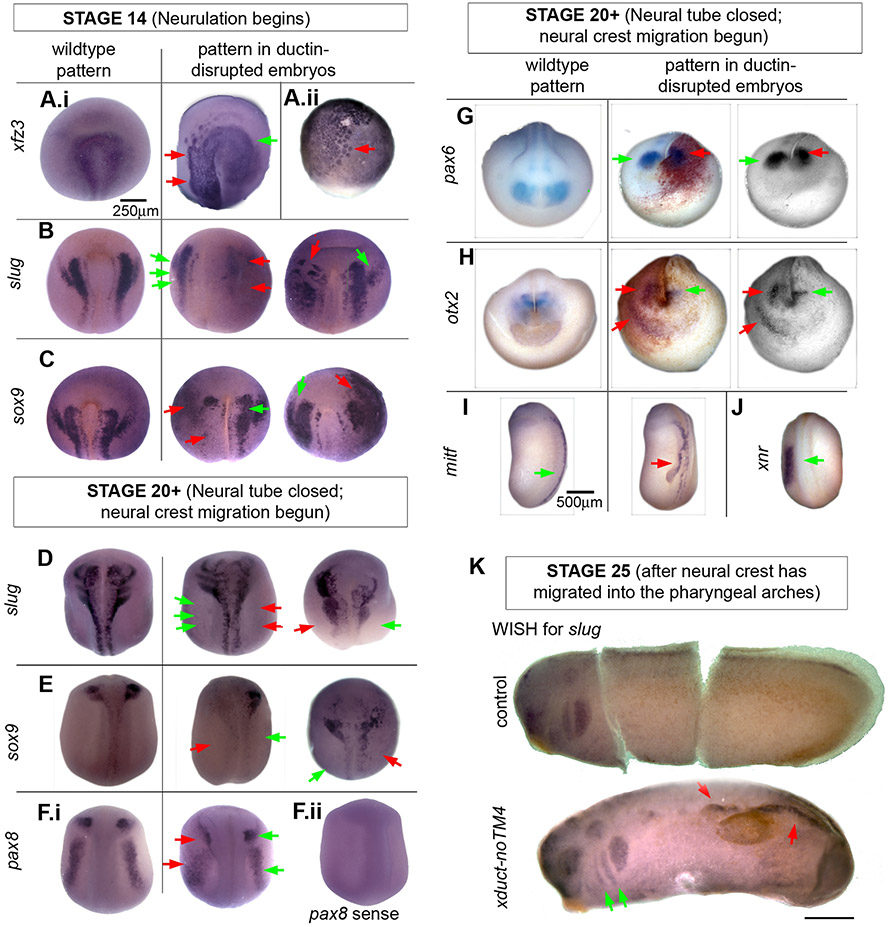
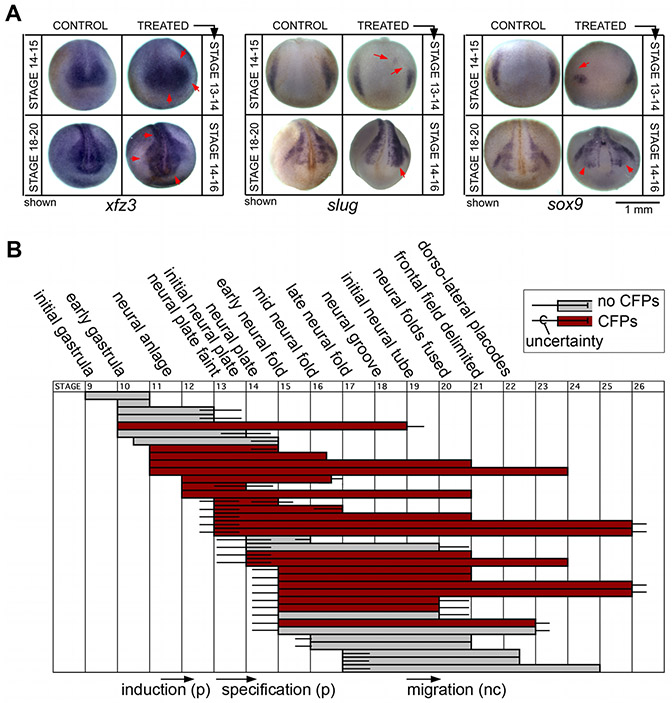
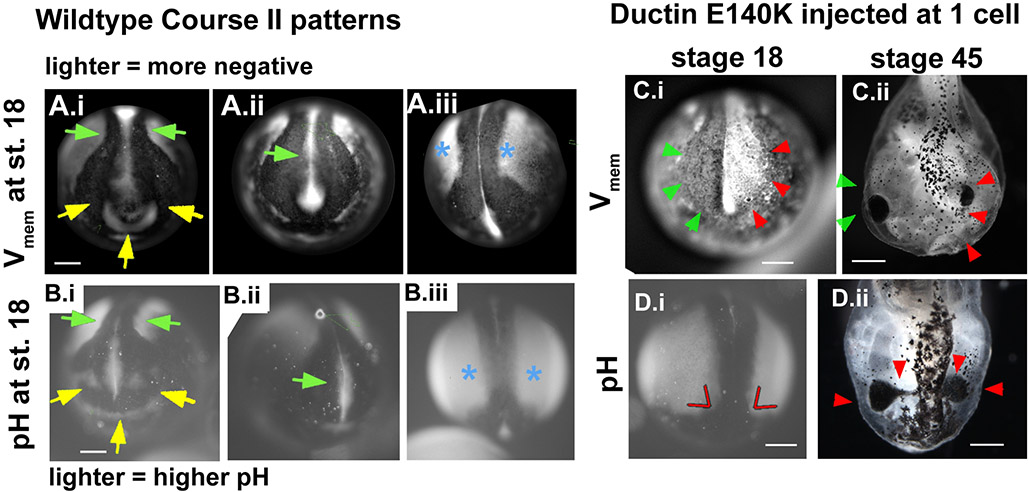
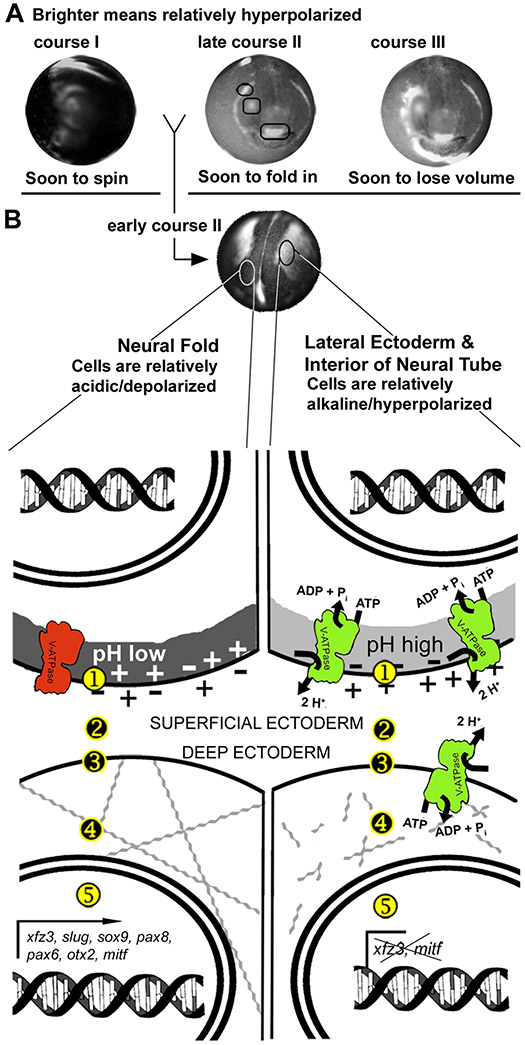
Using voltage and pH reporter dyes, we have discovered a never-before-seen regionalization of the Xenopus ectoderm, with cell subpopulations delimited by different membrane voltage and pH. We distinguished three courses of bioelectrical activity. Course I is a wave of hyperpolarization that travels across the gastrula. Course II comprises the appearance of patterns that match shape changes and gene expression domains of the developing face; hyperpolarization marks folding epithelium and both hyperpolarized and depolarized regions overlap domains of head patterning genes. In Course III, localized regions of hyperpolarization form at various positions, expand, and disappear. Inhibiting H(+) -transport by the H(+) -V-ATPase causes abnormalities in: (1) the morphology of craniofacial structures; (2) Course II voltage patterns; and (3) patterns of sox9, pax8, slug, mitf, xfz3, otx2, and pax6. We conclude that this bioelectric signal has a role in development of the face. Thus, it exemplifies an important, under-studied mechanism of developmental regulation.


Figures

Figure 1:
Figure 1:. Ductin basics.
(A.i) Ductin (purple) is part of the transmembrane proton transporting V0 domain of the H+-V-ATPase (Entrez Gene Name: ATPase, H+ transporting, lysosomal 16kD, V0 subunit c; drawing after Hinton et al., 2009). The V0 domain includes a hexamer comprising four ductin monomers plus two similar proteins, c’ and c’’. Protons (⊕) enter subunit a on the cytoplasmic side (upper thin black arrow) and are picked up by a glutamic acid (E140, green) in TM4 of ductin. After rotation (curved, open arrow), ductin delivers the proton to another site in subunit a, which releases it to the other side of the membrane (lower thin black arrow). (A.ii) The H+-V-ATPase acidifies the lumen of intracellular vesicles, including lysosomes. In some cells, it is present in the plasma membrane. (B) The amino acid sequence of ductin is very highly conserved. The four transmembrane domains are indicated by the purple background; the proton binding E is indicated by the green arrowhead. The top sequence is Xenopus ductin, the next is xduct-noTM4. Below that are the cow, chick, mouse, rat, human and zebrafish sequences.
Figure 2.
Figure 2.. Regions of relatively hyperpolarized (brighter) and depolarized (darker) Xenopus ectodermal cells are highly dynamic from stage 13 to stage 27.
Stages are approximate due to the limitations of judging two dimensional images. Scale bars = 250 μm. Orientation of the dorsal-ventral axis is indicated by lines, except in B 13 to 17 where circles indicate that the embryo is rolling towards the viewer; the V indicates the position of the ventral side, while the orange arrowhead indicates the approximate position of the anterior pole. (A) Ventrolateral view of course I. A wave of hyperpolarization travels across the embryo in approximately 15 minutes, then is stationary for several minutes before disappearing. Time (t) is in minutes. (B) The first panel shows a ventral view of an embryo at stage 13 in which the circle of hyperpolarized cells of course I is directly visible. Course II of the bioelectric activity begins at approximately stage 14. The visible signal emitted by the interior of the neural tube is particularly intense compared with the rest of the embryo, and changes shape between stages 14 and 19, including an hourglass at 16 to a teardrop at 17 (green arrows). At stage 18, the signal from the neural tube appears to thin. A patch of hyperpolarized cells just anterior to the neural tube signal, at the position of the stomodeum, appears, grows, then remains until approximately stage 23 (yellow arrows, and circles in C). Also at stage 18, hyperpolarized regions appear lateral to the neural folds on the dorsal side; the anterior extents of these regions are visible at the top of these images (orange arrows; see also Fig. 7A). These are visible from stage 18 until stage 21. At stage 19, lateral to the stomodeal region and apposed to the dorsolateral corners of the cement gland, foci of hyperpolarization appear, then spread as thin lines both ventrally, underlining the cement gland, and dorsally, reaching the lateral edges of the neural folds by stage 20 (brown arrows), forming a semicircle, approximately in the position of the first pharyngeal pouch. Also at stage 19, a spot of hyperpolarization appears in the right eye/olfactory placode field (blue arrow). At stage 26, the hyperpolarized spot that formed in the eye/olfactory placode area is still present, but by stage 27, that spot is much reduced and in the position of the olfactory placode (light purple arrow). A hyperpolarized spot in the approximate position of the otic placode is also visible at this stage (magenta arrow). (C) In course III, foci of hyperpolarity (circled in red) appear, spread, and disappear at different positions on the surface of the embryo, coincident with embryo stretching (compare stage 20 to stage 22). Also shown is that a course III area can spread over a course II area (blue and yellow circled areas) without disturbing it.
Figure 3.
Figure 3.. Range of tadpole craniofacial phenotypes caused by injection of xduct-noTM4 at the 1, 2, or 4 cell stage.
Tadpoles were scored and imaged between stage 45 and 48. In all images, large red arrowheads (red) indicate abnormalities of jaws and branchial arches, large blue arrowheads (blue) indicate eye or pigment abnormalities, small yellow arrowheads (yellow) indicate olfactory pit abnormalities, small orange arrowheads (orange) indicate otocyst and/or otolith abnormalities, and small white arrowheads (white) indicate abnormal brain tissue. All views are dorsal except where indicated by a V (ventral) or a P (profile). Anterior is up except in panels K and R in which anterior is left and dorsal is up. All scale bars = 1 mm unless otherwise indicated. (A) Wildtype morphology, dorsal and ventral aspects; drawing summarizes major structures (scale bar = 500μm). (B) Ventral and dorsal views of a tadpole with badly malformed jaw and left branchial arches (red) as well as a malformed otolith (B.ii orange). (C) Ventral view of a tadpole with small left-sided branchial arches (red). (D) Ventral and dorsal views of a tadpole with left-sided abnormalities of the jaw, branchial arches (red), eye, (blue) and olfactory pit (yellow). (E) Ventral view of malformed left-sided branchial arches (red). (F) Ventral view of bilateral abnormalities of the jaws and branchial arches, which lack the normal teeth (red). The left eye of this tadpole is not visible and thus abnormal (blue). (G) Bilateral abnormalities of the jaw (red), eyes (blue), and otoliths (orange); the branchial arches are also small. (H) Pigmentation of the optic nerve (blue), a commonly seen abnormality. (I) Thickening and pigmentation of the connection between the eye and brain (blue) is also commonly observed. This tadpole also has a malformed or missing olfactory pit (yellow) and abnormal growth of the brain (white). (J) Unilateral changes to the olfactory pit (yellow) eye (blue) and branchial arches (red). In this tadpole, the eye appears to be directly attached to the brain. (K) Eye with two lenses; it is not clear which lens is ectopic (blue). (Scale bar = 250 μm) (L) Embryo with a small eye (blue) and missing otocyst/otolith (orange). (M) Tadpole with ectopic pigment near to the eye (blue), extra brain tissue (white) and missing otocyst/otolith (orange). (N) Tadpole with malformed eyes and ectopic pigment along the midline (blue), as well as brain shape abnormalities (white). (O) Tadpole with an ectopic eye, connected to the original by a pigmented bridge (blue) that is fused with the olfactory pit (yellow). (P) Tadpole with left-sided abnormalities including small branchial arches (red), and a second brain (white) apparently fused to a large distorted eye (blue) and olfactory pit (yellow). (Q) Tadpole with small outgrowth of brain (white), a mis-formed otocyst (orange) and a missing otolith on the left side. (R) Ectopic otoliths growing along the dorsal midline (scale bar = 500 μm). (S) This froglet received xduct-noTM4 at the one cell stage, developed into a tadpole with a malformed eye, then metamorphosed. The eye abnormality is still visible (blue).
Figure 4.
Figure 4.. Wholemount in situ hybridization (WISH) indicates that ductin-dependent H+-flux is upstream of RNAs in the CNC and placode signaling pathways.
Embryos injected with xduct-noTM4 were probed for developmentally regulated mRNAs. In all images, red arrows point to abnormal and green to normal staining patterns. (A-C) Dorsal/anterior views of WISH in stage 14 embryos showing the wildtype pattern (left), an injected embryo with lower than normal expression (center), and an injected embryo with higher than normal expression (right). (A.i) xfz3 a marker of neural crest; no embryos were found that had loss of xfz3 staining on one side but were otherwise normal. (A.ii) In many xduct-noTM4 injected specimens, cells staining positively for xfz3 appear larger than normal at early stages (stage 10 shown). (B) slug, a marker of CNC cells. (C) sox9, at this stage a marker for otic capsule formation. (D-H) Embryos at stage 20. (D) slug, a marker of CNC cells; (E) sox9, a marker for otic capsule formation and CNC; (F) pax8, a marker for neural plate, otic capsule, and retina. (F.ii) Control using the pax8 sense strand lacks non-specific staining; all other sense strand controls were also negative (not shown). (G) Expression of pax6, an eye-field marker. Middle column: β-gal, used to label the injected side of the embryo, shows that the disruption to pax6 expression is on the injected side. Right column: A red filter was placed on the camera to give a clear image of the WISH signal. (H) Expression of otx2, a marker for olfactory placode and lens. Middle and right columns as in G. Like pax6, otx2 is posterior to its normal domain on the injected side. Ectopic staining is also apparent. (I) At stage 22, expression of mitf, a marker for the neural crest melanocyte lineage, is visible in a region appearing to be ectopic neural fold. (J) At stage 22, normal sized, one-sided expression domain of xnr-1 in a ductin-disrupted embryo shows that ductin inhibition does not affect other patterning genes. (K) Stage 25 embryos stained for slug. The top embryo is an untreated control (cut to lay flat for imaging) showing the normal staining of slug in the pharyngeal arches. The lower embryo was injected with xduct-noTM4 into one blastomere at the 2-cell stage. The pharyngeal arches have been populated normally, but there is ectopic staining of slug; both of these observations are consistent with neural crest cell motility being unaffected by ductin disruption.
Figure 5.
Figure 5.. Inhibition of ductin by concanamycin affects WISH patterns and indicates that ductin is required during late gastrulation and early neural plate stages.
(A) Treatment of embryos with the highly-specific ductin inhibitor concanamycin leads to changes in the WISH patterns of xfz3, slug, and sox9. Like injection of xduct-noTM4, these changes can be seen as early as stage 14 and are still apparent at stage 20. Embryos in the top row of each panel were exposed to concanamycin from stage 13 to stage 14, then fixed at stage 14-15 for WISH; embryos in the bottom row were exposed from stage 14 to stage 16, then fixed at stage 18-20 for WISH. Timing was chosen on the basis of the concanamycin exposure experiments shown in B. (B) Effect of exposure to the ductin-inhibitor concanamycin at different stages (indicated on the top and bottom); each horizontal bar represents a batch of embryos treated with concanamycin; gray bars indicate that this sample did not have significantly more CFPs than the untreated control, red bars indicate a significant difference of >10% between controls and experimentals (α=0.01). Error bars represent an estimate of the uncertainty of identifying stages. Exposure to concanamycin from stage 13 to 16 caused craniofacial abnormalities.
Figure 6.
Figure 6.. Ductin is present at high levels in the superficial ectoderm during neural plate stages.
(A) Immunohistochemistry for ductin on cross-sections from neurulating embryos. (A.i) Germ layers are indicated on the DIC image of the section in A.ii. (A.ii) Green is autofluorescence of the section, red is ductin signal. Ductin is ubiquitous, but stains most strongly in the superficial ectoderm (SE) at this stage. (B) Cross sections through the dorsal midline showing various configurations of the neural fold. In all sections, ductin signal is strongest in the SE. (C) Higher magnification shows ductin concentrated in, although not exclusively localized to, the SE. (D.i) Control section exposed to 2° Ab only. The left side of image has been manipulated in Photoshop to show the position of the section; right side of image shows the actual signal at same exposure as B. (D.ii) Control sections exposed to peptide-adsorbed antibody; sides as in D.i.
Figure 7.
Figure 7.. Inhibition of ductin causes changes in voltage patterns that correlate with CF phenotypes.
(A) Stills of wildtype embryos showing the pattern of Vmem in the anterior and antero-dorsal regions of neurulae at approximately stage 18. Arrowheads point to the most consistent features of the pattern (11 of 11 uninjected embryos). (A.i) Green arrows point to depolarized neural folds. Yellow arrows point to hyperpolarization in the future olfactory/oral region. (A.ii) Green arrow points to the disappearing signal from the neural tube floor. (A.iii) Blue asterisks mark hyperpolarized ectodermal regions lateral to the neural folds. (B) The pattern of pH in the anterior and antero-dorsal regions of untreated neurulae. Arrowheads point to features of a normal pattern, and are the same as Vmem shown in A. (C, D) Abnormal regionalization of Vmem and pH caused by injection of xduct-noTM4. (C.i) Abnormal Vmem patterns were seen in 9 of 13 injected embryos. Green arrowheads point to the normal depolarized neural folds, red arrows to the abnormal hyperpolarized side. (D.i) Red lines indicate the abnormal angle between the high pH lateral ectoderm and the low pH anterior folds. (C.ii, D.ii) The same embryos imaged at stage 45 display gross malformations (red arrows) in the areas with abnormal Vmem or pH.
Figure 8.
Figure 8.. Summary model of Vmem/pH dependent signaling.
(A) The three courses of electrophysiological activity (Fig. 2). At approximately stage 18, a consistent pattern appears: depolarized neural folds (darker), hyperpolarized lateral ectoderm (brighter). (B) A typical wildtype stage 18 embryo. The pattern shown here for Vmem compartments matches the pattern seen for pH compartments at the same stage. Drawings illustrate our model. The Vmem and pH of the SE cells, labeled ① in the drawing, influence gene expression in the nearby deep cells, labeled ⑤. The electrophysiological state of the SE cell can influence the genes of the deep cell by various mechanisms, (①, ②, ③, and ④). Secretion of signaling molecules can be affected by the H+-V-ATPase-dependent control of vesicle pH (①), consistent with Cruciat (2010). Proteins on the surface of the SE cell (②) can be voltage or pH gated; many only function in a narrow range of pH or Vmem. The pH of the intercellular space (②), would also affect diffusible signaling molecules, or the receptors on the surface of the deep cells (③), by the same mechanism. After reaching the surface of the deep cell, the signal could be carried to the nucleus by any of a myriad of signaling pathways. We also hypothesize that the bioelectric signal originating in the SE cells affects the mechanical state of the cells. One hypothesis is that changes in Vmem open voltage-gated Ca2+ channels (③), leading to Ca2+-dependent changes in the cytoskeleton (④), an important player in cell shape change and invagination. Another possibility is that Vmem changes trigger voltage gated ion channels (③), causing ion and thus water efflux, changing the osmotic pressure of the cells, and thus their resistance to shape change. This is consistent with our observation that cells expressing abnormally high amounts of xfz3 often appear larger.

References

    1. Adams DS. 2008. A new tool for tissue engineers: ions as regulators of morphogenesis during development and regeneration. Tissue Eng Part A 14:1461–1468. - PubMed
    1. Adams DS, Masi A, Levin M. 2007. H+ pump-dependent changes in membrane voltage are an early mechanism necessary and sufficient to induce Xenopus tail regeneration. Development 134:1323–1335. - PubMed
    1. Adams DS, Robinson KR, Fukumoto T, Yuan S, Albertson RC, Yelick P, Kuo L, McSweeney M, Levin M. 2006. Early, H+-V-ATPase-dependent proton flux is necessary for consistent left-right patterning of non-mammalian vertebrates. Development 133:1657–1671. - PMC - PubMed
    1. Anderson T, Sparkowski J, Goldstein DJ, Schlegel R. 1995. Vacuolar H(+)-ATPase mutants transform cells and define a binding site for the papillomavirus E5 oncoprotein. J Biol Chem 270:6830–6837. - PubMed
    1. Blackiston D, Adams DS, Lemire JM, Lobikin M, Levin M. 2011. Transmembrane potential of GlyCl-expressing instructor cells induces a neoplastic-like conversion of melanocytes via a serotonergic pathway. Dis Model Mech 4:67–85. - PMC - PubMed

Publication types

MeSH terms