. 2012 Sep;33(9):2005-34.
doi: 10.1002/hbm.21338. Epub 2011 Jul 14.

Probabilistic tractography recovers a rostrocaudal trajectory of connectivity variability in the human insular cortex

Affiliations

Probabilistic tractography recovers a rostrocaudal trajectory of connectivity variability in the human insular cortex

Leonardo Cerliani et al. Hum Brain Mapp. 2012 Sep.

Abstract

The insular cortex of macaques has a wide spectrum of anatomical connections whose distribution is related to its heterogeneous cytoarchitecture. Although there is evidence of a similar cytoarchitectural arrangement in humans, the anatomical connectivity of the insula in the human brain has not yet been investigated in vivo. In the present work, we used in vivo probabilistic white-matter tractography and Laplacian eigenmaps (LE) to study the variation of connectivity patterns across insular territories in humans. In each subject and hemisphere, we recovered a rostrocaudal trajectory of connectivity variation ranging from the anterior dorsal and ventral insula to the dorsal caudal part of the long insular gyri. LE suggested that regional transitions among tractography patterns in the insula occur more gradually than in other brain regions. In particular, the change in tractography patterns was more gradual in the insula than in the medial premotor region, where a sharp transition between different tractography patterns was found. The recovered trajectory of connectivity variation in the insula suggests a relation between connectivity and cytoarchitecture in humans resembling that previously found in macaques: tractography seeds from the anterior insula were mainly found in limbic and paralimbic regions and in anterior parts of the inferior frontal gyrus, while seeds from caudal insular territories mostly reached parietal and posterior temporal cortices. Regions in the putative dysgranular insula displayed more heterogeneous connectivity patterns, with regional differences related to the proximity with either putative granular or agranular regions.


Figures

Figure 1
Figure 1
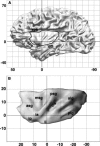
Definition of the insula ROI. A: Surface rendering of the left brain in one subject at approximately mid‐way through the cortical gray matter (cortical layer 4) [Van Essen,2005]. The coordinates (0,0) indicate the Y and Z location of the anterior commissure (AC). Large parts of the frontal, parietal, and temporal opercula were removed to show the location of the insula and the landmarks chosen to draw the ROI: anterior periinsular sulcus (aps), superior periinsular sulcus (sps), and inferior periinsular sulcus (ips). The dotted line connecting the limen insulae (li) with the insular pole (ip) represents the ideal boundary between the anterior ventral insula and the posterior orbitofrontal cortex. A detailed description of the drawing of the insula ROI in the subjects' volumes is provided in the main text. B: Surface rendering of the insular cortex in the same subject. This subject was chosen to show the morphology of the insula, because it presents the most common configuration of the short and long gyri according to the dissection studies conducted by Türe [1999]. Abbreviations: alg, anterior long gyrus; aps, anterior periinsular sulcus; asg, anterior short gyrus; cis, central insular sulcus; ia, insular apex; ip, insular pole; ips, inferior periinsular sulcus; li, limen insulae; msg, middle short gyrus; plg, posterior long gyrus; psg, posterior short gyrus; sps, superior periinsular sulcus.
Figure 2
Figure 2
Computation of the Laplacian eigenmap of the insular connectivity feature vectors in a single subject. Left column: Similarity matrix A, containing the correlation values between each and every other seed voxel's connectivity maps calculated by probabilistic tractography. Colors indicate the value of the Pearson correlation coefficient R. Middle column: The matrix A was fed into the algorithm of the Laplacian eigenmaps (see details in the main text and in the Supporting Information) in order to assess the presence of a structure of connectivity variability across all seeds. The algorithm maps the feature vectors, which are originally points in R n (a space in n dimensions) as points in R 2 (a plane), so that the proximity in R 2 reflects the proximity in R n. The recovered one‐dimensional structure suggests to the presence of a variation between two extremes with very different connectivity, while the absence of large discontinuities (further quantified in the comparison with the medial premotor region—See Methods and Results sections: gradual versus clustered trajectory of connectivity variability, and Fig. 5) suggests that the variation of the connectivity patterns across insular voxels was gradual rather than organized in clusters with sharply different connectivity patterns. The distance from the minimum value on the x axis was calculated for each voxel, normalized in the range 0..1 and mapped on the anatomical surface of each subject's insula (Right column). Note that the distances in the Laplacian eigenmap only reflect distances across feature vectors (and ultimately across the connectivity patterns of each seed voxel), while they do not reflect per se distances in millimeters in the anatomy: the topographical organization of values assigned to the seed voxels emerges only when those distances are mapped onto the anatomy. For the purposes of visualization, Caret (http://www.nitrc.org/projects/caret/) was used to segment gray and white matter and produce fiducial surface representation [Van Essen,2005] of the insula at approximately mid‐way through the cortical gray matter (cortical layer 4) [Van Essen et al.,2001]. The coordinates (0,0) indicate the Y and Z location of the anterior commissure. [Color figure can be viewed in the online issue, which is available at wileyonlinelibrary.com.]
Figure 3
Figure 3
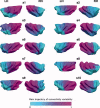
Laplacian eigenmaps of the insula for each subject: Laplacian eigenmaps of the connectivity feature vectors derived from the in vivo probabilistic tractography in each subject and hemisphere. For purposes of visualization, Caret (http://www.nitrc.org/projects/caret/) was used to segment gray and white matter and produce fiducial surface representation [Van Essen,2005] of the insula at approximately mid‐way through the cortical gray matter (cortical layer 4) [Van Essen et al.,2001]. The final images of the surfaces and the mapping of the metrics derived from the Laplacian eigenmaps were rendered by means of Paraview (http://www.www.paraview.org/). Values on the surface were mapped from the volume containing the results of Laplacian eigenmaps and quantifying the distance along the main trajectory of connectivity variability: each vertex on the surface was assigned the value of the closest voxel in the volume.
Figure 4
Figure 4
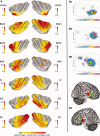
Average trajectory of connectivity variability and maximum number of tractography samples per target voxels. Average trajectory of connectivity variability (upper row): For visualization purposes, after calculating the Laplacian eigenmaps of the insular connectivity for each subject and each hemisphere, and replotting them into each subject's anatomical space, the volumes were transformed into the standard MNI space (see details in Methods section: Laplacian eigenmaps of the insula), and the median value for each insular voxel belonging to at least half of the participants was calculated and mapped onto the insular surface of the MNI single subject template [Holmes et al.,1998]. This illustration serves to show the rostrocaudal topographical arrangement of the recovered trajectory of connectivity variability, spanning from the most anterior insular territory, in the anterior short gyrus and in the ventral anterior insula around the limen, to the posterior insular territory, in the dorsal caudal long gyri and adjacent central insular sulcus. The same trajectory of variability was recovered in all subjects, as it can be appreciated from Figure 3. Additional analyses, comparing the single subject's Laplacian eigenmaps of insula and medial premotor cortex, were performed to test for the gradual versus clustered organization of connectivity patterns (see Methods and Results sections: Gradual versus clustered trajectory of connection variability; Discussion section: Gradual variation of connectivity patterns). Maximum number of tractography samples per target voxels (lower row): We thresholded the single subject's connectivity map for each seed voxel to a minimum of 50 samples, and we considered only target brain voxels reached in at least half of the participants (five subjects). Then, we color‐matched each of the surviving target brain voxels with the insular location, derived from the average trajectory of connectivity map, from which it received the maximum number of samples, averaged over all subjects present in that location. [Color figure can be viewed in the online issue, which is available at wileyonlinelibrary.com.]
Figure 5
Figure 5
Comparison between insula and medial premotor cortex. A: Laplacian eigenmaps identified the main trajectory of connectivity variability in the insula along the rostrocaudal axis. The absence of large gaps in the Laplacian eigenmap suggests the presence of a smooth transition across different connectivity patterns. B: On the other hand, the medial premotor cortex (mPMC) features a sharp transition between clusters with different connectivity patterns, which are evidenced by the presence of large gaps in the corresponding Laplacian eigenmap. The Laplacian eigenmap of the mPMC is overlaid onto the MNI single subject template to show that the transition is located on the plane through the anterior commissure (indicated by the crosshairs). The size of the largest gaps in the Laplacian eigenmaps of insula and mPMC was therefore taken as a measure of the presence of sharp transition in connectivity patterns and compared between the two seed regions across all subjects. C: Boxplots (median, interquartile range, and most extreme values within 1.5 times the interquartile range) of the maximum detected gap in the Laplacian eigenmaps of insula and mPMC in both hemispheres. Wilcoxon signed‐rank test showed a significant difference between the medians of the maximum detected gap in the insula and the mPMC. [Color figure can be viewed in the online issue, which is available at wileyonlinelibrary.com.]
Figure 6
Figure 6
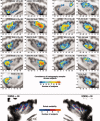
Connection probability maps with cytoarchitectonically defined regions and results from previous fMRI meta‐analyses. A: Average (median) connection probability for each insular voxel present in at least half of the participants (five subjects), calculated for the maximum probability maps (MPM) of several cytoarchitectonically defined regions in the atlas of Juelich [Eickhoff et al.,2005b]. The values are plotted on the insular surface of the MNI single subject template. The Limbic ROI (amygdala, EC, and hippocampus), BA44, BA45, BA6, primary somatosensory cortex (SI), superior (SPL), and inferior (IPL) parietal lobule MPMs were chosen to evaluate the different connection probability of different insular territories because of their known connectivity with the insula from animal studies as well as for the wide range of cortical types that they span. The anterior ventral insula, putative location of the agranular insula, had the highest connection probability with the limbic ROI, while the highest connection probability with posterior parietal regions was found in the posterior gyri of the insula, putative location of the granular, and adjacent dysgranular insula. These two regions featured the two extremes of the trajectory of connection probability found with Laplacian eigenmaps (see Figs. 3 and 4). B1–B3: Maps showing the results of the meta‐analysis of the functional organization of the anterior insula performed by Mutschler et al. ([2009]—reproduced with permission of Elsevier) on 58 fMRI studies, reporting in total 159 peaks of activation. B1 refers to studies related to peripheral and autonomic changes as well as co‐activation of voxels in the insula and in the amygdala; B2 refers to studies on auditory and language processing; B3 refers to studies involving hand movements. B4: Result of the meta‐analysis performed by [Kurth et al., 2010] on coordinates from 1768 studies retrieved from the BrainMap database [Fox et al., 2005a; Laird et al.,2005,2009] and Pubmed. In the result shown here (adapted from Fig. 7 in Kurth et al. [2010] and reprinted with permission of Springer), studies from 13 functional categories were grouped in four domains to investigate the presence of domain‐specific functional specialization in the entire insular cortex: sensorimotor (red), cognitive (green), chemical sensory (yellow), and social emotional (blue). [Color figure can be viewed in the online issue, which is available at wileyonlinelibrary.com.]
Figure 7
Figure 7
Lateralization and consistency maps. Up: Consistency maps showing for each insular voxel the amount of subjects which showed an above‐threshold amount of tractography samples to each of the seven examined targets: Limbic ROI (amygdala, enthorinal cortex, and hippocampus), BA44, BA45, and BA6, primary somatosensory cortex (SI), superior (SPL), and inferior (IPL) parietal lobule. The parasagittal slice showed here was chosen to display the coordinate corresponding to the maximum overlap across subjects. For clarity, only voxels with three or more overlapping subjects are displayed. In the case of SI, IPL, and BA45, consistent projections across subjects were found in two spatially different insular territories (in one or both hemispheres). Black diamonds indicate the locations of the center of gravity (COG) of the connected cluster in different subjects. Down: Sulcal variability map. After registration of each‐subject skull‐stripped anatomical (T1‐weighted) image to the MNI single subject template [Holmes et al.,1998], sulcal outlines were drawn manually on two single sagittal slices. The consistency map of the location of the sulci across is presented here overlaid onto the average anatomy across all the participants. The outline of each subject's sulci can be seen in Supporting Information Figure S4. [Color figure can be viewed in the online issue, which is available at wileyonlinelibrary.com.]
Figure 8
Figure 8
Comparison with functional studies. The average trajectory of connectivity variability is overlaid onto the MNI single subject template. Only voxels belonging to at least half of the participants (five subjects) are mapped. Blue dots indicate the y and z coordinates of the local maxima for fMRI studies on motor control of speech in the following studies: (1) Dronkers [1996], (2) Blank et al. [2002], (3) Nestor et al. [2003], (4) Plante et al. [2006], (5a) and (5b) Saur et al. [2006], and (6) Geiser et al. [2008]. These locations are all in the insular territories where the strongest projections to BA44, BA45, and BA6 were found (see Fig. 6). Red and yellow dots indicate the locations from Ostrowsky et al. [2002] where intracortical stimulations elicited either painful (yellow) or nonpainful (red) sensations. Note the prevalent location in the long gyri of the insula, which we found to have maximum connection probability with somatosensory and posterior parietal regions (see Fig. 6). The meta‐analysis of Schweinhardt et al. [2006] identified in the rostral anterior insula (rAI), caudally delimited by the short insular sulcus (dashed black line), as specifically involved in clinical pain with respect to nociceptive (experimental) pain, involving more posterior insular regions. The limbic lobe was found in the present study to receive projections mostly from the same insular territories (anterior short gyrus and ventral anterior insula—see Fig. 6). [Color figure can be viewed in the online issue, which is available at wileyonlinelibrary.com.]

Similar articles

Cited by

References

    1. Ackermann H, Riecker A ( 2004): The contribution of the insula to motor aspects of speech production: A review and a hypothesis. Brain Lang 89: 320–328. - PubMed
    1. Ackermann H, Riecker A ( 2010): The contribution(s) of the insula to speech production: A review of the clinical and functional imaging literature. Brain Struct Funct 214: 419–433. - PubMed
    1. Ackermann H, Riecker A, Mathiak K, Erb M, Grodd W, Wildgruber D ( 2001): Rate‐dependent activation of a prefrontal‐insular‐cerebellar network during passive listening to trains of click stimuli: An fMRI study. Neuroreport 12: 4087–4092. - PubMed
    1. Afif A, Mertens P ( 2010): Description of sulcal organization of the insular cortex. Surg Radiol Anat 32: 491–498. - PubMed
    1. Aggleton JP, Burton MJ, Passingham RE ( 1980): Cortical and subcortical afferents to the amygdala of the rhesus monkey (Macaca mulatta). Brain Res 190: 347–368. - PubMed