

A compressed sensing approach for MR tissue contrast synthesis
- PMID: 21761671
- PMCID: PMC3398746
- DOI: 10.1007/978-3-642-22092-0_31
A compressed sensing approach for MR tissue contrast synthesis
Abstract
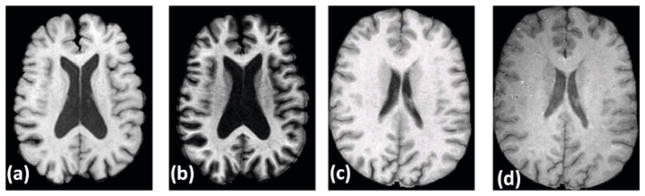
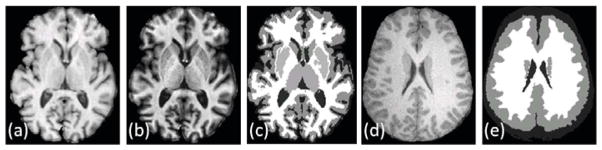
The tissue contrast of a magnetic resonance (MR) neuroimaging data set has a major impact on image analysis tasks like registration and segmentation. It has been one of the core challenges of medical imaging to guarantee the consistency of these tasks regardless of the contrasts of the MR data. Inconsistencies in image analysis are attributable in part to variations in tissue contrast, which in turn arise from operator variations during image acquisition as well as software and hardware differences in the MR scanners. It is also a common problem that images with a desired tissue contrast are completely missing in a given data set for reasons of cost, acquisition time, forgetfulness, or patient comfort. Absence of this data can hamper the detailed, automatic analysis of some or all data sets in a scientific study. A method to synthesize missing MR tissue contrasts from available acquired images using an atlas containing the desired contrast and a patch-based compressed sensing strategy is described. An important application of this general approach is to synthesize a particular tissue contrast from multiple studies using a single atlas, thereby normalizing all data sets into a common intensity space. Experiments on real data, obtained using different scanners and pulse sequences, show improvement in segmentation consistency, which could be extremely valuable in the pooling of multi-site multi-scanner neuroimaging studies.
Figures
References
-
- Bazin PL, Pham DL. Topology-preserving tissue classification of magnetic resonance brain images. IEEE Trans on Medical Imaging. 2007;26(4):487–496. - PubMed
-
- Bezdek JC. A Convergence Theorem for the Fuzzy ISO-DATA Clustering Algorithms. IEEE Trans on Pattern Anal Machine Intell. 1980;20(1):1–8. - PubMed
-
- Candes EJ, Romberg JK, Tao T. Stable signal recovery from incomplete and inaccurate measurements. Comm on Pure and Appl Math. 2006;59(8):1207–1223.
-
- Christensen JD. Normalization of brain magnetic resonance images using histogram even-order derivative analysis. Mag Res Imaging. 2003;21(7):817–820. - PubMed
-
- Clark KA, Woods RP, Rottenber DA, Toga AW, Mazziotta JC. Impact of acquisition protocols and processing streams on tissue segmentation of T1 weighted MR images. NeuroImage. 2006;29(1):185–202. - PubMed
Publication types
MeSH terms
Substances
Grants and funding
LinkOut - more resources
Full Text Sources
Other Literature Sources
Medical