. 2011 Jul 15:12:365.
doi: 10.1186/1471-2164-12-365.

Integration of genome-wide computation DRE search, AhR ChIP-chip and gene expression analyses of TCDD-elicited responses in the mouse liver

Affiliations

Integration of genome-wide computation DRE search, AhR ChIP-chip and gene expression analyses of TCDD-elicited responses in the mouse liver

Edward Dere et al. BMC Genomics. .

Abstract

Background: The aryl hydrocarbon receptor (AhR) is a ligand-activated transcription factor (TF) that mediates responses to 2,3,7,8-tetrachlorodibenzo-p-dioxin (TCDD). Integration of TCDD-induced genome-wide AhR enrichment, differential gene expression and computational dioxin response element (DRE) analyses further elucidate the hepatic AhR regulatory network.

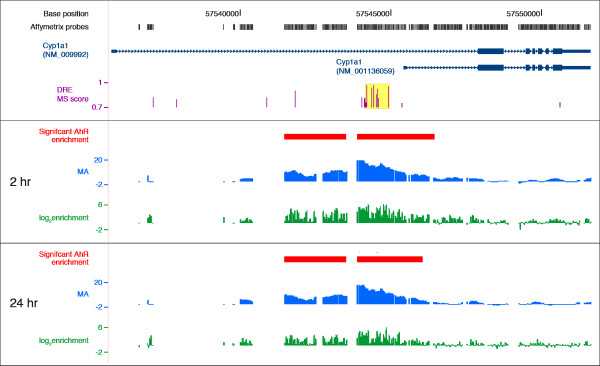
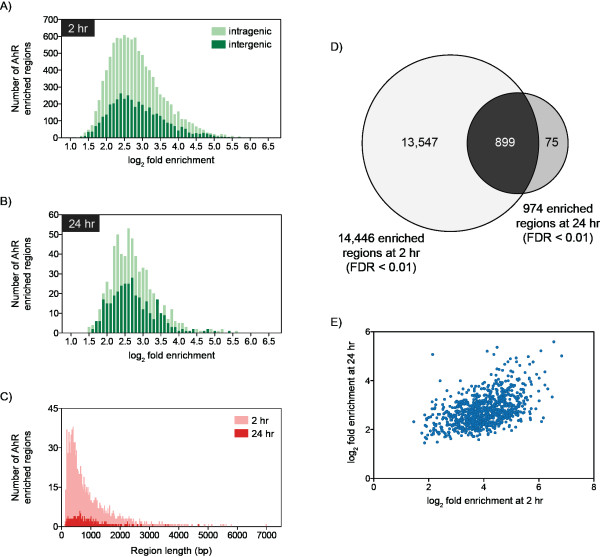
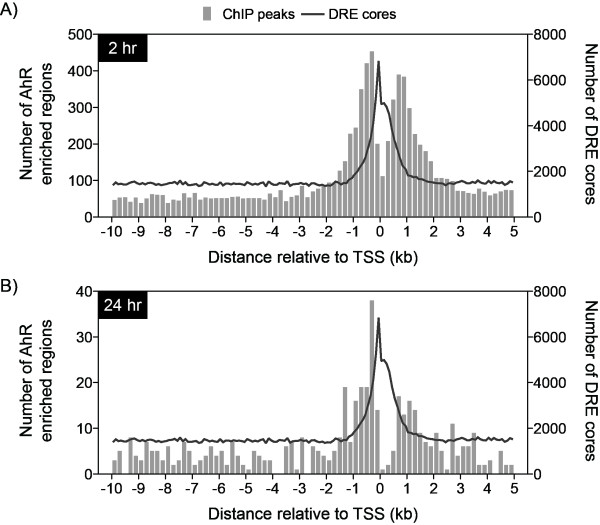
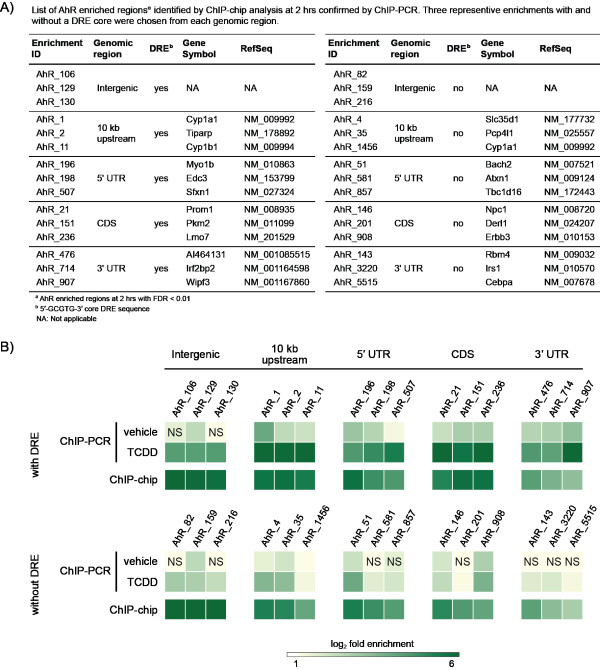
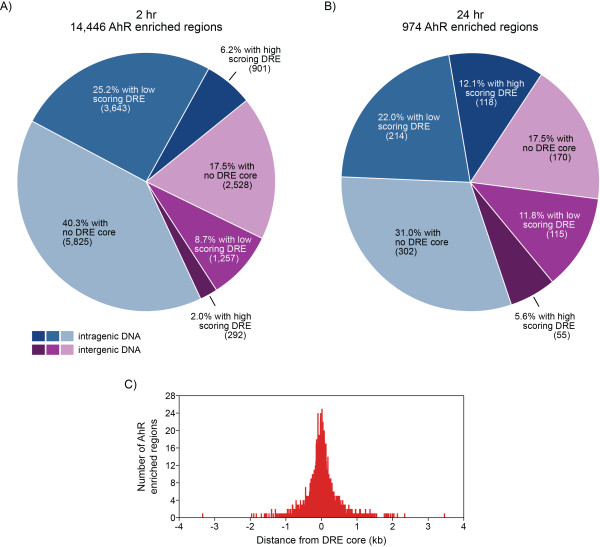
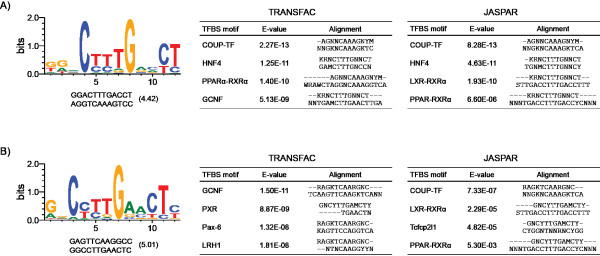
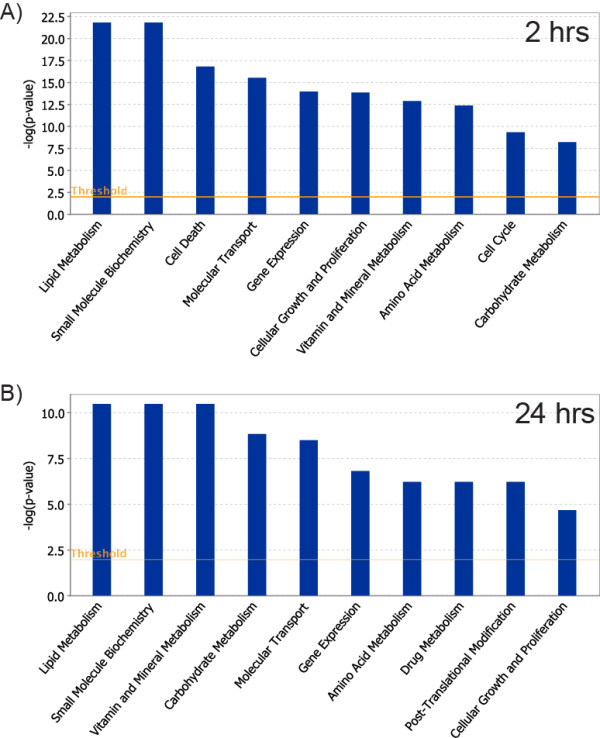
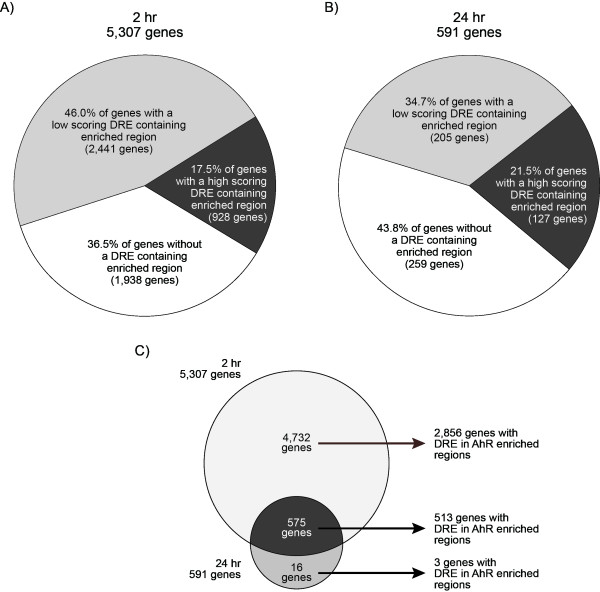
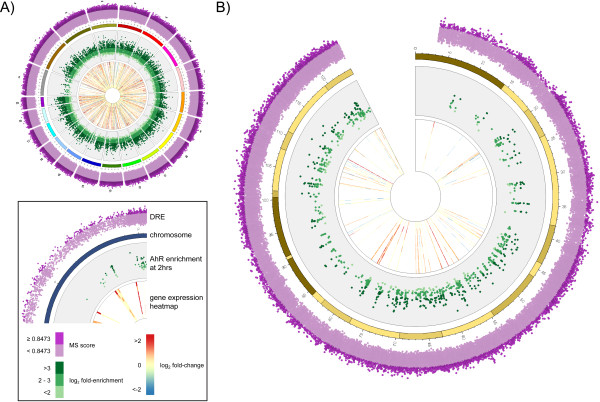
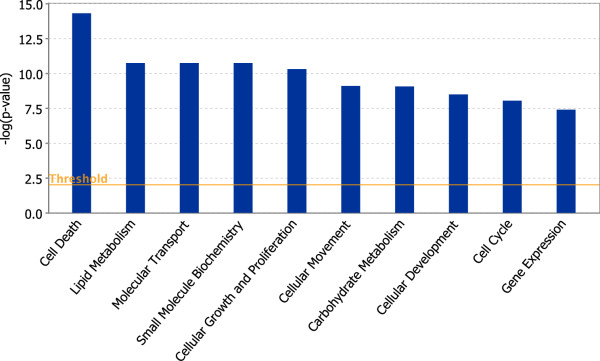
Results: Global ChIP-chip and gene expression analyses were performed on hepatic tissue from immature ovariectomized mice orally gavaged with 30 μg/kg TCDD. ChIP-chip analysis identified 14,446 and 974 AhR enriched regions (1% false discovery rate) at 2 and 24 hrs, respectively. Enrichment density was greatest in the proximal promoter, and more specifically, within ± 1.5 kb of a transcriptional start site (TSS). AhR enrichment also occurred distal to a TSS (e.g. intergenic DNA and 3' UTR), extending the potential gene expression regulatory roles of the AhR. Although TF binding site analyses identified over-represented DRE sequences within enriched regions, approximately 50% of all AhR enriched regions lacked a DRE core (5'-GCGTG-3'). Microarray analysis identified 1,896 number of TCDD-responsive genes (|fold change| ≥ 1.5, P1(t) > 0.999). Integrating this gene expression data with our ChIP-chip and DRE analyses only identified 625 differentially expressed genes that involved an AhR interaction at a DRE. Functional annotation analysis of differentially regulated genes associated with AhR enrichment identified overrepresented processes related to fatty acid and lipid metabolism and transport, and xenobiotic metabolism, which are consistent with TCDD-elicited steatosis in the mouse liver.

Conclusions: Details of the AhR regulatory network have been expanded to include AhR-DNA interactions within intragenic and intergenic genomic regions. Moreover, the AhR can interact with DNA independent of a DRE core suggesting there are alternative mechanisms of AhR-mediated gene regulation.


Figures

Figure 1
Figure 1
Summary of AhR enrichment within Cyp1a1 genic region at 2 and 24 hrs. Cyp1a1 is represented by two RefSeq sequences (NM_009992 and NM_001136059, dark blue tracks) that have different TSSs (dark blue box at far left). The rectangles and lines represent exons and introns, respectively, and the UTRs are depicted as the thinner rectangles. Arrowhead direction indicates the orientation of the gene. The grey boxes above represent the Affymetrix 2.0R mouse tiling array probe locations across the Cyp1a1 genic regions. The location and matrix similarity (MS) scores of the consensus DREs are represented by the purple histogram. The highlighted yellow box identifies bona fide functional DREs (matrix similarity (MS) score ≥ 0.8473) involved in AhR-mediated Cyp1a1 gene expression. The red boxes identify regions of significant AhR enrichments (FDR < 0.01) based on the moving average (MA) profile by TileMap. The green histogram plots the log2 fold enrichment values for each individual probe.
Figure 2
Figure 2
Characterization of TCDD-induced AhR enriched regions at 2 and 24 hrs (FDR < 0.01). Frequency analysis of enriched regions relative to log2 fold enrichment at 2 hr (A) and 24 hr (B) illustrating enrichment values in intragenic (light green) and intergenic (dark green) DNA regions. Distribution of enriched regions relative to region width (C) at 2 hrs (light red) and 24 hrs (dark red) identified 90.5% of enriched sites were ≤ 1,500 bp. Comparison of AhR enriched regions at 2 and 24 hrs identified 899 overlapping regions (D). Analysis of the fold enrichment values for the 899 overlapping regions at 2 and 24 hrs identified a positive correlation (two-tailed P-value < 0.0001, Pearson correlation coefficient = 0.4853; E).
Figure 3
Figure 3
TCDD-induced AhR enrichment (FDR < 0.01) densities in the proximal promoter (10 kb upstream and 5 kb downstream of a TSS) at 2 hrs (A) and 24 hrs (B). The bars represent the number of enriched regions in each 200 bp window. The number of DRE cores in 100 bp non-overlapping windows is superimposed (line) illustrating the overlap between AhR enriched regions and DRE cores in the proximal promoter region.
Figure 4
Figure 4
Confirmation of hepatic TCDD-induced AhR enrichment identified by ChIP-chip analysis (FDR < 0.01) at 2 hrs by ChIP-PCR. Selected regions were chosen for verification based on position relative to a TSS, ChIP-chip fold enrichment and the presence or lack of a DRE core within the region of enrichment (A). Immunoprecipitated DNA was measured by QRTPCR and AhR enrichment was calculated as fold induction above IgG controls. The color intensity of each box represents the mean value of three independent replicates. NS = not significant compared to IgG controls (p < 0.05). 2 hr ChIP-chip enrichment values are provided in Additional File 1.
Figure 5
Figure 5
Mapping TCDD-induced AhR enriched regions (FDR < 0.01) with DRE locations. Regions of enrichment identified in the intergenic (purple) and intragenic (blue) DNA regions of the genome at 2 hrs (A) and 24 hrs (B) were searched for high scoring (putative functional) DRE sequences (matrix similarity score ≥ 0.8473; dark blue and dark purple segments) and low scoring DRE sequences (matrix similarity score < 0.8473; mid blue and mid purple segments) using a position weight matrix developed from bona fide functional DREs [8]. Light blue and light purple segments represent regions with no DRE core sequence. A total of 6,595 enriched regions (6,093 at 2 hrs and 502 at 24 hrs) contained at least one DRE core (5'-GCGTG-3'). 50% of these regions were within 135 bp of a DRE core (based on the location of maximum enrichment within the enriched region; C).
Figure 6
Figure 6
De novo motif analysis of intragenic (A) and intergenic (B) AhR enriched regions lacking a DRE core. The non-repetitive over-represented motifs from each region are shown with their consensus and reverse complement sequence, and the Gibbs motif sampler score. Over-represented motifs were associated with specific TFBSs in JASPAR and TRANSFAC based on the consensus sequence alignments and E-value scores.
Figure 7
Figure 7
Molecular and cellar functions over-represented by genes associated with significant AhR enrichment (FDR < 0.01) containing a DRE core. The 4,544 and 332 unique genes with AhR enrichment with a DRE core at 2 hrs (A) and 24 hrs (B), respectively, were analyzed using Ingenuity Pathway Analysis for enriched biological functions using Fisher's Exact Test (p < 0.01; orange line). The blue bars represent the log Odds value calculated from the p-value of each functional group.
Figure 8
Figure 8
Mapping TCDD-induced AhR enriched regions (FDR < 0.01) and DRE analysis to genes. The 10,283 and 660 AhR enrichments within the intragenic DNA regions at 2 and 24 hrs (blue shaded areas in Figures 5A-B) mapped to 5,307 (A) and 591 (B) distinct genes based on the refGene data from the UCSC Genome Browser. These genes were searched for the presence of high (matrix similarity score (MS) ≥ 0.8473; dark grey areas) and low (MS score < 0.84731; light grey areas) scoring DRE sequences, and the absence of a DRE core (white areas) within the region of AhR enrichment. Comparing 2 and 24 hrs data identified 575 overlapping genes with AhR enrichment and 513 of these genes contained a DRE core within the region of enrichment (C).
Figure 9
Figure 9
Circos plots integrating DRE analysis, AhR enrichment (2 hrs; FDR < 0.01) and heatmaps for hepatic differential gene expression responses (|fold change| ≥ 1.5 and P1(t) > 0.999) induced by TCDD across the genome (A) and chromosome 9 (B). The inset legend image provides information represented by each data ring. DRE matrix similarity (MS) scores and AhR enrichment values increase radially outward. The time points for the gene expression heatmaps also increase radial outward. The arc of each heatmap wedge maps directly to the location of the gene in the genome. The arc length is proportional to the length of the transcribed region. Circos plots for the other chromosomes are provided in Additional File 12.
Figure 10
Figure 10
Molecular and cellar functions over-represented by differentially regulated genes (|fold change| ≥ 1.5, P1(t) > 0.999) associated with significant AhR enrichment (FDR < 0.01) at 2 hrs. The 900 differentially regulated genes with AhR enrichment were analyzed using Ingenuity Pathway Analysis for enriched biological functions using Fisher's Exact Test (p < 0.01; orange line). The blue bars represent the log Odds value calculated from the p-value of each functional group.

Similar articles

Cited by

References

    1. Gu Y, Hogenesch J, Bradfield C. The PAS superfamily: sensors of environmental and developmental signals. Annu Rev Pharmacol Toxicol. 2000;40:519–561. doi: 10.1146/annurev.pharmtox.40.1.519. - DOI - PubMed
    1. Denison MS, Heath-Pagliuso S. The Ah receptor: a regulator of the biochemical and toxicological actions of structurally diverse chemicals. Bulletin of environmental contamination and toxicology. 1998;61:557–568. doi: 10.1007/PL00002973. - DOI - PubMed
    1. Poland A, Knutson JC. 2,3,7,8-tetrachlorodibenzo-p-dioxin and related halogenated aromatic hydrocarbons: examination of the mechanism of toxicity. Annu Rev Pharmacol Toxicol. 1982;22:517–554. doi: 10.1146/annurev.pa.22.040182.002505. - DOI - PubMed
    1. Hankinson O. The aryl hydrocarbon receptor complex. Annu Rev Pharmacol Toxicol. 1995;35:307–340. doi: 10.1146/annurev.pa.35.040195.001515. - DOI - PubMed
    1. Okey AB, Vella LM, Harper PA. Detection and characterization of a low affinity form of cytosolic Ah receptor in livers of mice nonresponsive to induction of cytochrome P1-450 by 3-methylcholanthrene. Molecular Pharmacology. 1989;35:823–830. - PubMed

Publication types

MeSH terms

LinkOut - more resources